W29 Market Review
A comprehensive overview of global market performance and key narratives.
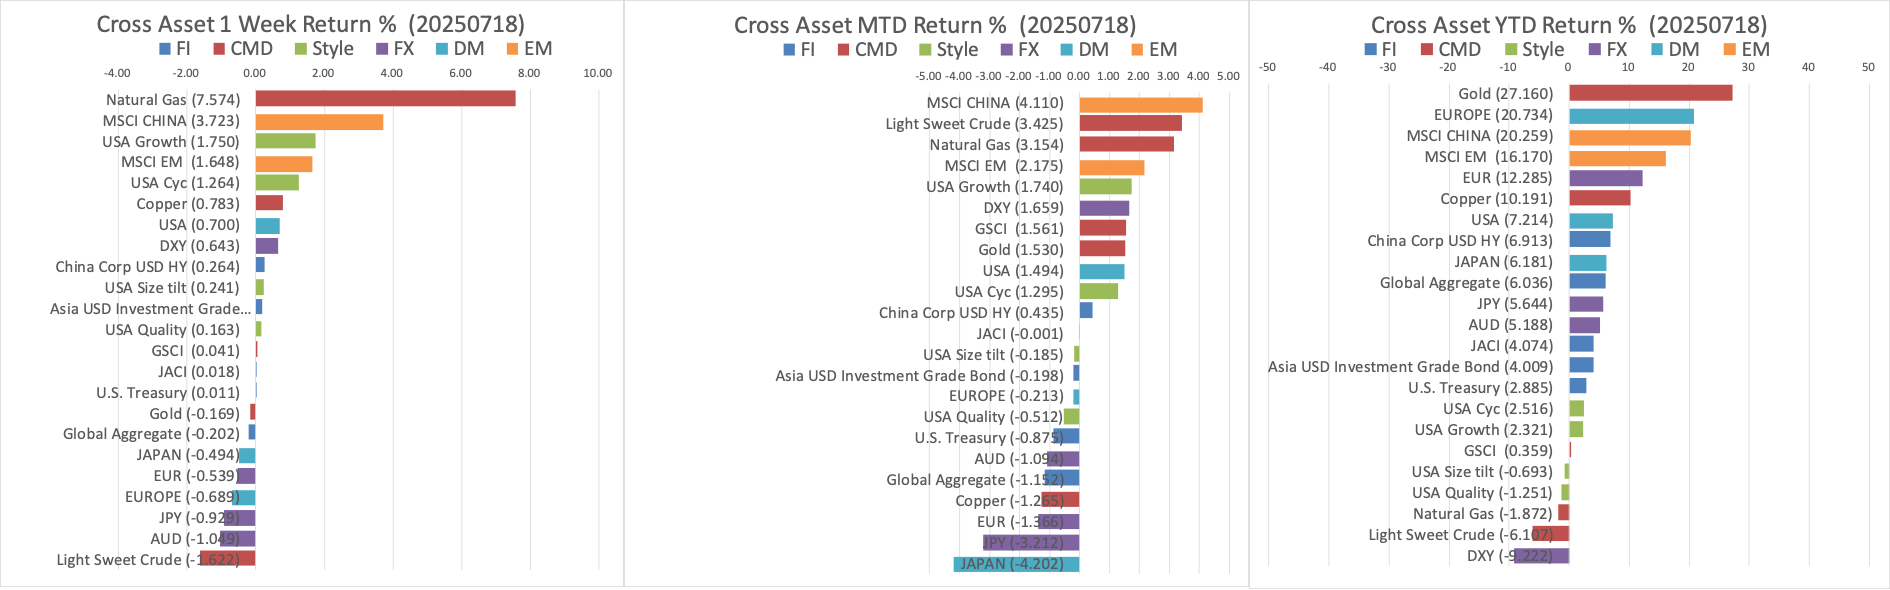
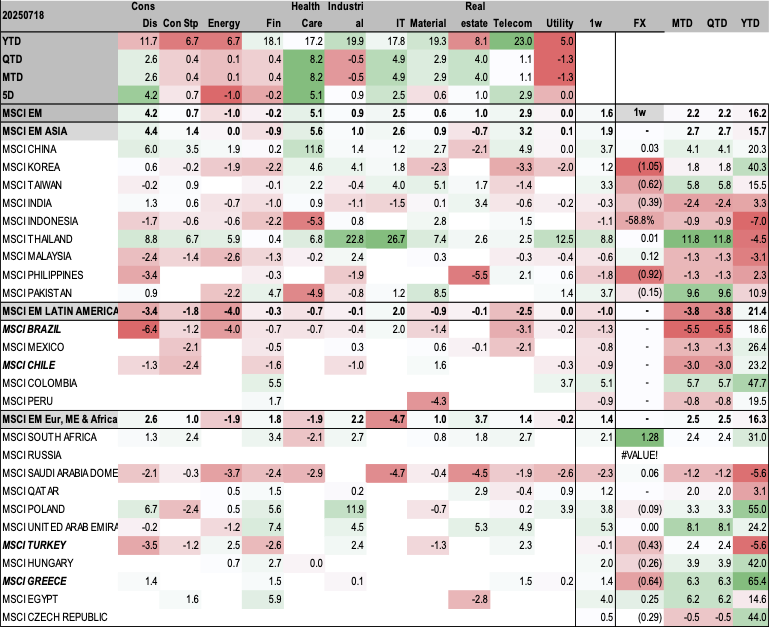
Cross Assets Performance
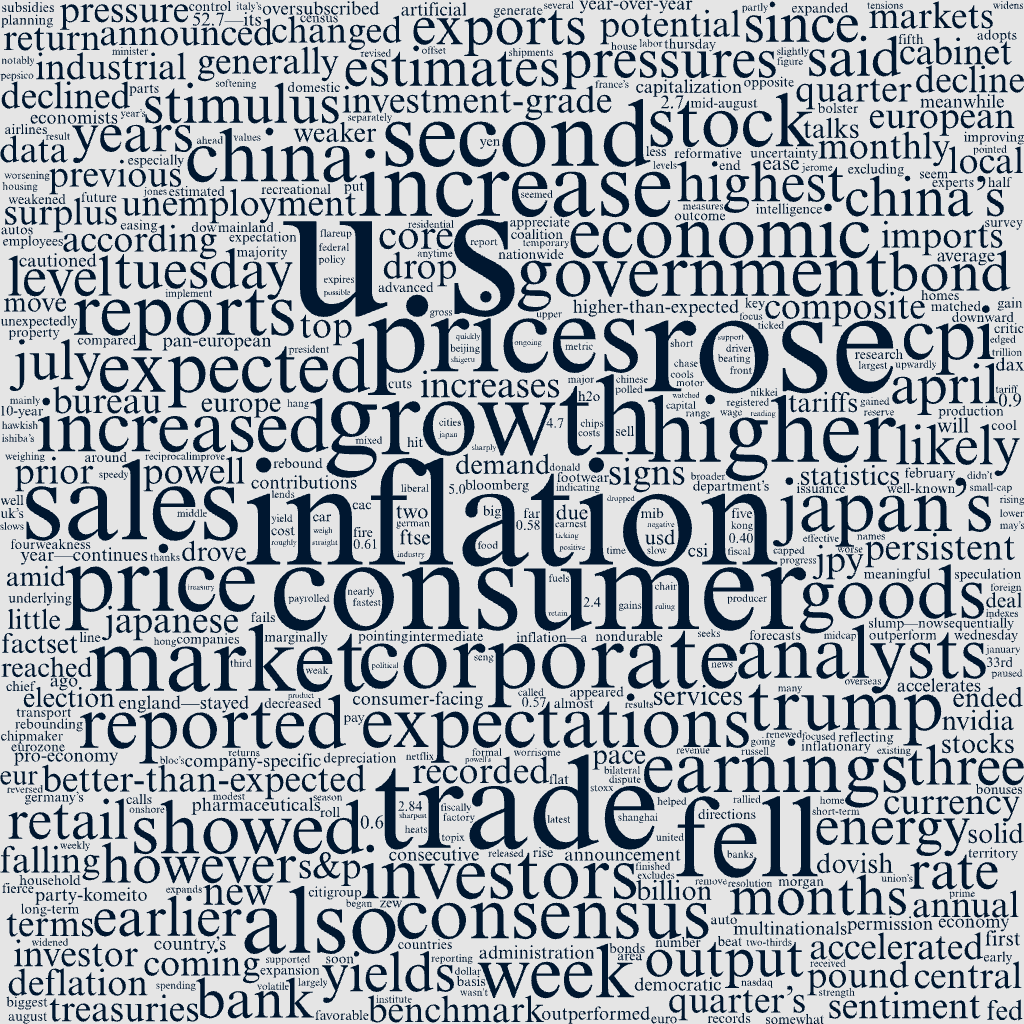
Markets Narratives
Macro Overview
- US consumer inflation heated up in June, with CPI increasing 0.3% MoM (up from 0.1% in May) and 2.7% YoY (up from 2.4% in May). Core CPI rose 2.9% YoY.
- UK inflation unexpectedly rose to 3.6% in June. Unemployment rate ticked higher to 4.7%, highest in four years, while wage growth slowed to 5.0%.
- Eurozone industrial production expanded by 1.7% MoM in May. Trade surplus widened to EUR 16.2 billion. German investor sentiment reached a three-year high of 52.7.
- Japan's core CPI cooled to 3.3% YoY in June. Exports fell 0.5% YoY for the second consecutive month.
- China's Q2 GDP grew 5.2% YoY, but analysts warned of worsening deflationary pressures (PPI fell 3.3% for the 33rd straight month) and a persistent housing market slump.
Policy Developments
- Speculation about President Trump firing Federal Reserve Chair Jerome Powell put temporary downward pressure on U.S. stocks, but this was quickly reversed.
- The U.S. announced a 25% reciprocal tariff on Japanese imports, effective August 1, though bilateral trade talks are ongoing.
- China’s statistics bureau reported Q2 GDP growth, easing pressure on Beijing for immediate further stimulus.
Market Narratives WordCloud
Overall Equity Market Performance
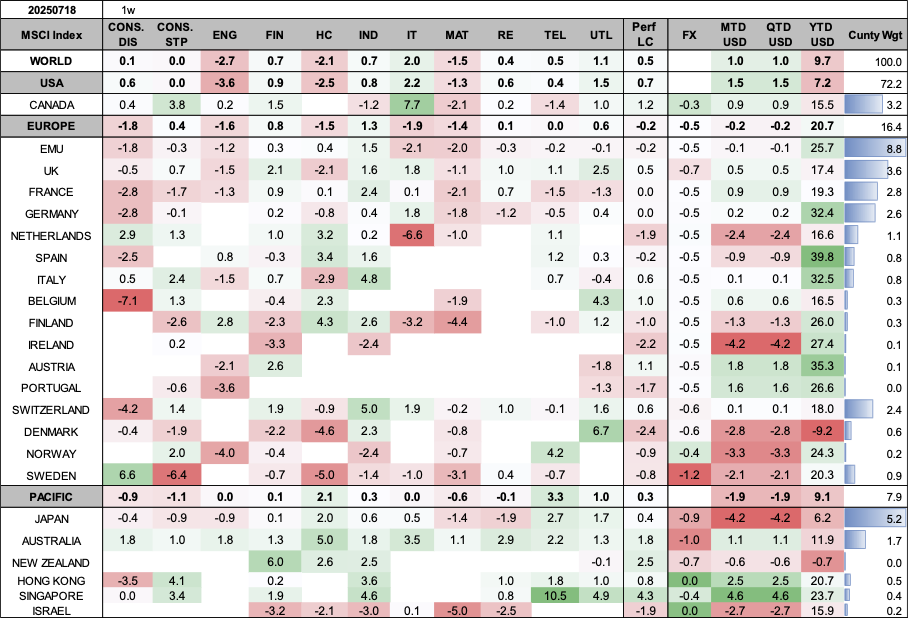

Market Review By Country
US Market Executive Summary
Consumer inflation heats up in U.S.
Key Highlights in Metrics
S&P 500 & Nasdaq
New Records
Overall Corporate Earnings
Solid
June CPI (MoM)
+0.3%
June Retail Sales (MoM)
+0.6%
Solid corporate earnings bolster stocks
The S&P 500 Index and Nasdaq Composite Index reached new records during the week, supported by solid corporate earnings reports and generally favorable economic data. The small-cap Russell 2000 was also positive, while the Dow Jones Industrial Average and S&P Midcap 400 Index ended in negative territory.
Earnings season began in earnest on Tuesday with several big banks reporting earnings. JP Morgan Chase, the largest U.S. bank, and Citigroup both reported better-than-expected results for the second quarter. Then on Thursday, well-known consumer-facing names such as PepsiCo, United Airlines, and Netflix released reports that beat forecasts.
In other company-specific news, chipmaker NVIDIA announced that it had received permission from the Trump administration to sell its H20 artificial intelligence chips to China. NVIDIA, which hit the $4 trillion market capitalization level for the first time in early July, rallied on the announcement.
Key Earnings Beat Highlights
| Company | Result |
|---|---|
| JP Morgan Chase & Citigroup | Better-than-expected Q2 results |
| PepsiCo, United Airlines, Netflix | Reports beat forecasts |
Stock investors also seemed to appreciate economic reports that pointed to consumer strength and inflation levels that, while not improving, didn’t seem too worrisome. Notably, the consumer price index (CPI) showed its biggest monthly increase in five months but generally matched consensus estimates.
Inflation & Retail Sales Overview (June)
| Metric | June MoM | May MoM | June YoY | May YoY |
|---|---|---|---|---|
| CPI | +0.3% | +0.1% | +2.7% | +2.4% |
| Core CPI | N/A | +2.9% | +2.8% | |
| Retail Sales | +0.6% | -0.9% | N/A | |
Investors were also focused on the Census Department’s retail sales report that showed sales up a better-than-expected 0.6% in June after falling 0.9% in May. Reports that President Donald Trump was planning to fire Federal Reserve Chair Jerome Powell put downward pressure on stocks on Wednesday, but the move was quickly reversed when Trump said he wasn’t going to remove Powell. Trump has been a fierce critic of the Fed chief as the central bank has paused further rate cuts so far this year.
Corporate bonds outperform Treasuries
Intermediate- and long-term U.S. Treasury yields finished the week little changed, while short-term yields marginally decreased amid speculation about Powell’s future at the Fed. (Bond prices and yields move in opposite directions.) The U.S. investment-grade corporate bond market outperformed Treasuries. Investment-grade corporate issuance was in line with expectations and was largely oversubscribed.
Europe Market Executive Summary
In local currency terms, the pan-European STOXX Europe 600 Index ended roughly flat as investors watched for signs of any progress in U.S. and European trade talks. Major stock indexes were mixed. Italy’s FTSE MIB gained 0.58%, while Germany’s DAX and France’s CAC 40 Index were little changed. The UK’s FTSE 100 Index rose 0.57%, helped partly by the depreciation of the UK pound against the U.S. dollar. A weaker pound lends support to the index because many of its companies are multinationals that generate meaningful overseas revenue.
Key Economic Data
UK CPI (Jun YoY)
+3.6%
UK Unemployment (May)
+4.7%
Eurozone Industrial Production (May MoM)
+1.7%
Eurozone Trade Surplus (May)
EUR 16.2bn
German ZEW Index (Jul)
52.7
UK inflation worse than expected; unemployment higher; wage growth slows
The annual rate of consumer price inflation in the UK unexpectedly rose to 3.6% in June from 3.4% in May, the fastest pace since January 2024. Higher prices for transport, especially motor fuels, drove the increase. Services inflation—a key metric for the Bank of England—stayed at 4.7%, indicating persistent underlying cost pressures. The consensus expectation had been for services inflation to ease.
UK Economic Indicators (June)
| Indicator | June Value | Previous Value (May) |
|---|---|---|
| CPI YoY | +3.6% | +3.4% |
| Unemployment Rate (May) | +4.7% | +4.6% |
| Pay Growth excl. Bonuses | +5.0% | +5.3% |
Industrial production in the euro area expanded by 1.7% sequentially in May, rebounding from the 2.2% decline recorded in April and beating market expectations for a rise of 0.9%. Increased output of energy, capital goods, and nondurable consumer goods drove the expansion. Year over year, output accelerated to 3.7% from 0.2% in the prior month.
Eurozone Key Data (May)
| Metric | Value (MoM) | Value (YoY) |
|---|---|---|
| Industrial Production | +1.7% | +3.7% |
| Trade Surplus | EUR 16.2bn (from 12.7bn YoY) | |
German investor sentiment highest in three years
The ZEW index of economic sentiment in July rose for a third consecutive month, coming in at 52.7—its highest level since February 2022. Analysts in a FactSet survey had expected a reading of 50.2. The economic research institute said almost two-thirds of experts polled called for the economy to improve, thanks to potential stimulus and expectations for a speedy resolution to the European Union’s trade dispute with the U.S.
Japan Market Executive Summary
Japan’s stock markets registered modest gains over the week, with the Nikkei 225 Index rising 0.63% and the broader TOPIX Index up 0.40%. Returns were capped by political uncertainty ahead of Japan’s Upper House election on July 20, where a possible outcome could be that Prime Minister Shigeru Ishiba’s ruling Liberal Democratic Party-Komeito coalition fails to retain majority control.
Market & Economic Overview
| Metric | Value |
|---|---|
| Nikkei 225 Index | +0.63% |
| TOPIX Index | +0.40% |
| 10-Year JGB Yield | +1.53% (from +1.49%) |
| JPY/USD Rate | ~JPY 148 (from JPY 147.4) |
Inflationary pressures showed some signs of easing, as Japan’s core consumer price index (CPI) rose 3.3% year on year in June, less than consensus estimates for a 3.4% increase and down from 3.7% in May. The softening in core inflation was due mainly to falling contributions from energy, reflecting government subsidies.
Inflation & Trade Data (June)
| Metric | Current Value | Previous Value / Consensus |
|---|---|---|
| Core CPI YoY | +3.3% | +3.7% (May) / +3.4% (Cons.) |
| Exports YoY | -0.5% | +0.5% (Cons.) |
China Market Executive Summary
Mainland Chinese stock markets recorded a weekly gain. The onshore benchmark CSI 300 Index rose 1.09% and the Shanghai Composite Index edged up 0.69% in local currency terms, according to FactSet. In Hong Kong, the benchmark Hang Seng Index advanced 2.84%.
GDP Growth Overview
| Quarter | YoY Growth |
|---|---|
| Q2 | +5.2% |
| Q1 | +5.4% |
However, analysts cautioned that growth would likely slow in the year’s second half amid worsening deflation pressures, weak retail sales growth, and the potential for a flareup in U.S. trade tensions once a temporary deal expires in mid-August. Earlier this month, China reported that its producer price index fell the most in nearly two years in June, the 33rd straight month of factory deflation.
Housing Market Overview (June MoM)
| Metric | Change |
|---|---|
| New Home Prices (70 cities) | -0.27% |
| Existing Home Values | -0.61% |
| Residential Sales YoY | -12.6% |
Key Market & Economic Data
CSI 300 Index
+1.09%
Shanghai Comp.
+0.69%
Hang Seng Index
+2.84%
Q2 GDP (YoY)
+5.2%
New Home Prices (Jun MoM)
-0.27%
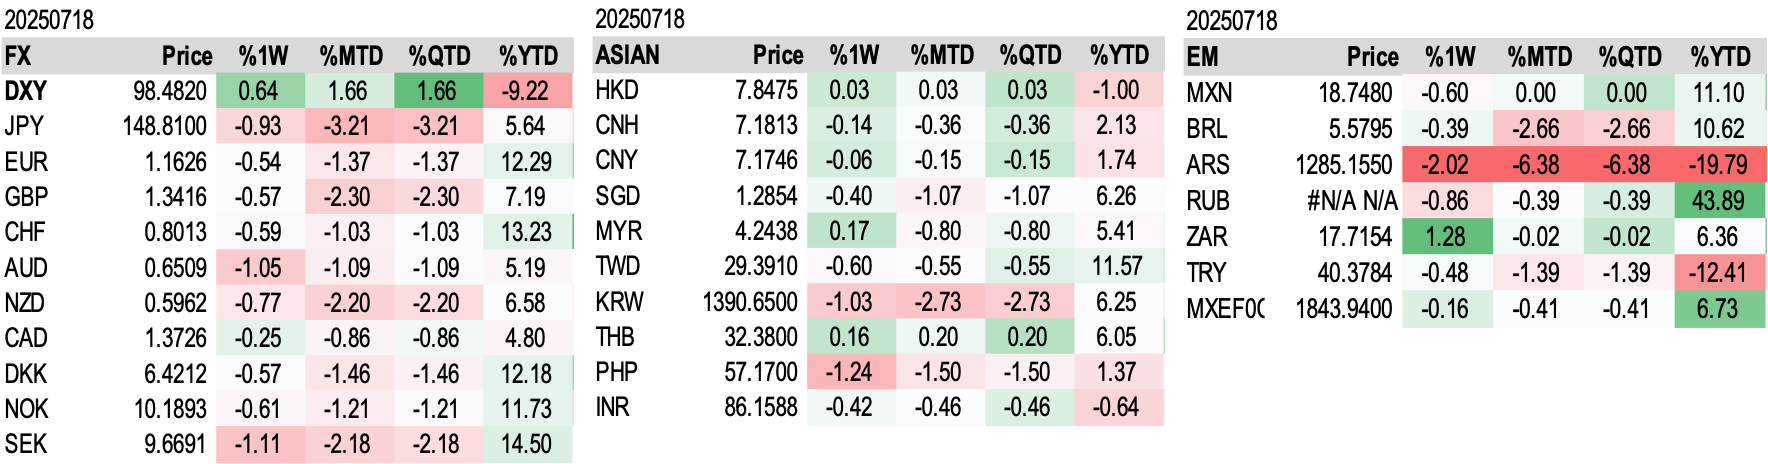
Foreign Exchange Performance
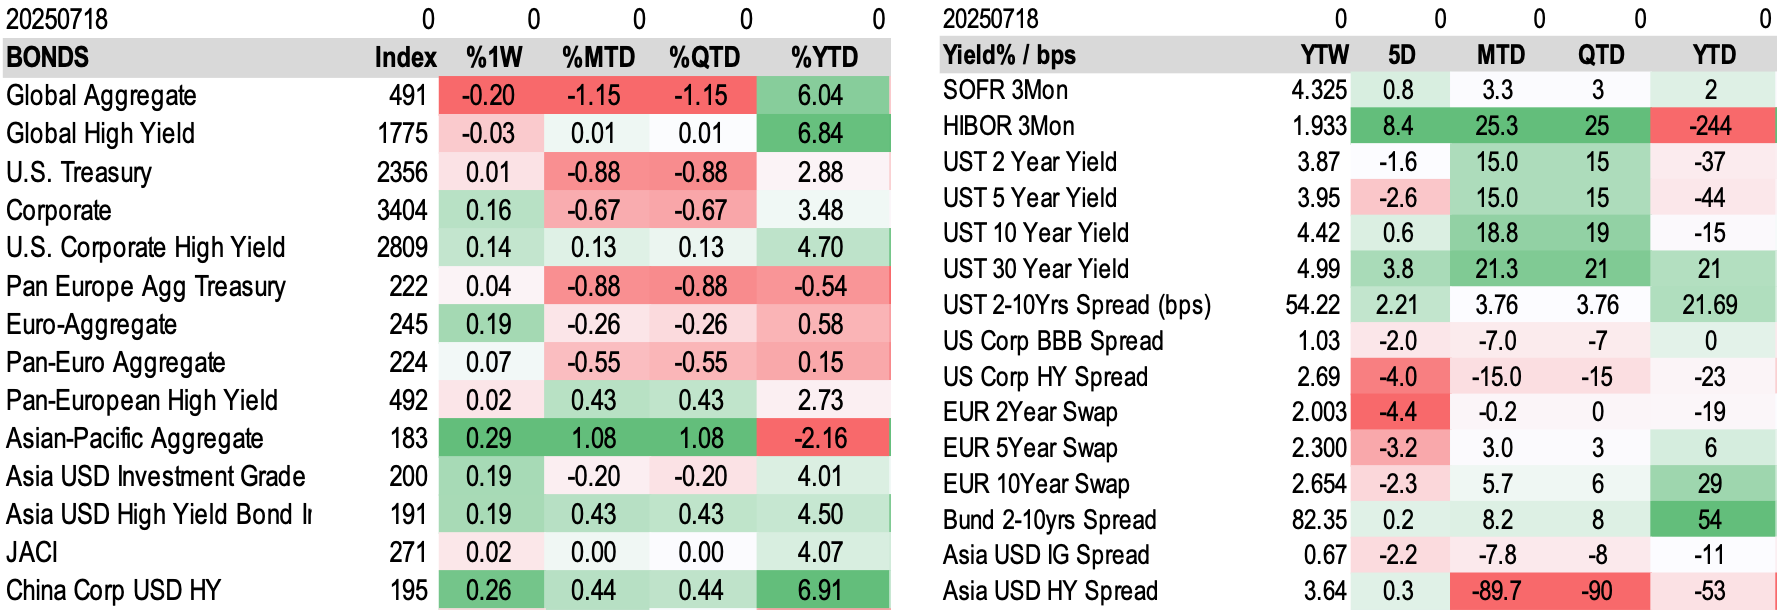
Fixed Income Performance
FactSet Updates
Earnings Revisions
S&P 500 Earnings & Revenue Consensus
Comparison of analyst consensus for S&P 500 year-over-year growth between this week and last week for Earnings and Revenue.
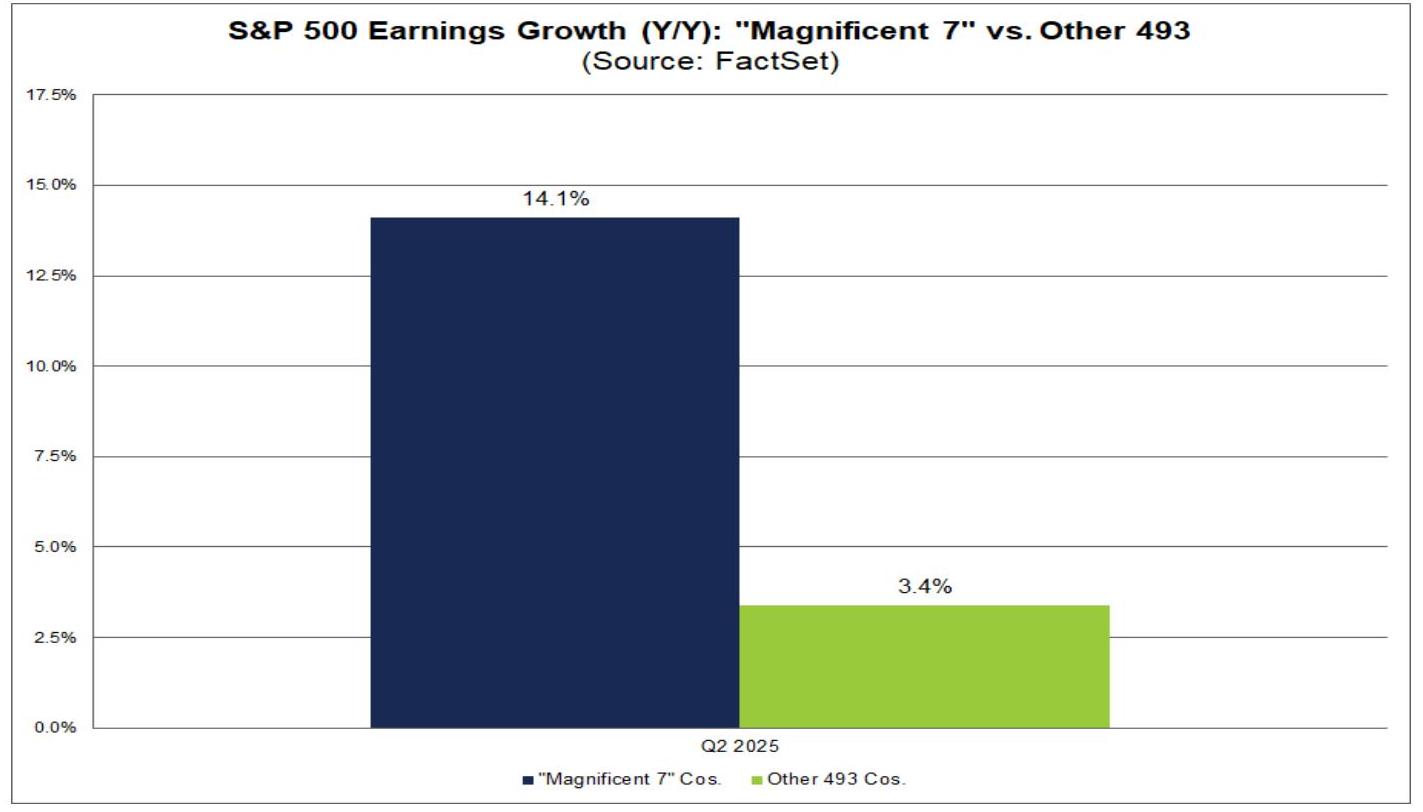
Topic 1: Are Magnificent 7 Still the Primary Contributors to S&P 500 Q2 Earnings Growth?
- The answer is yes. Magnificent 7 companies remain a significant driver of S&P 500 earnings growth.
- S&P 500 overall earnings growth rate for Q2 2025 is 5.6%.
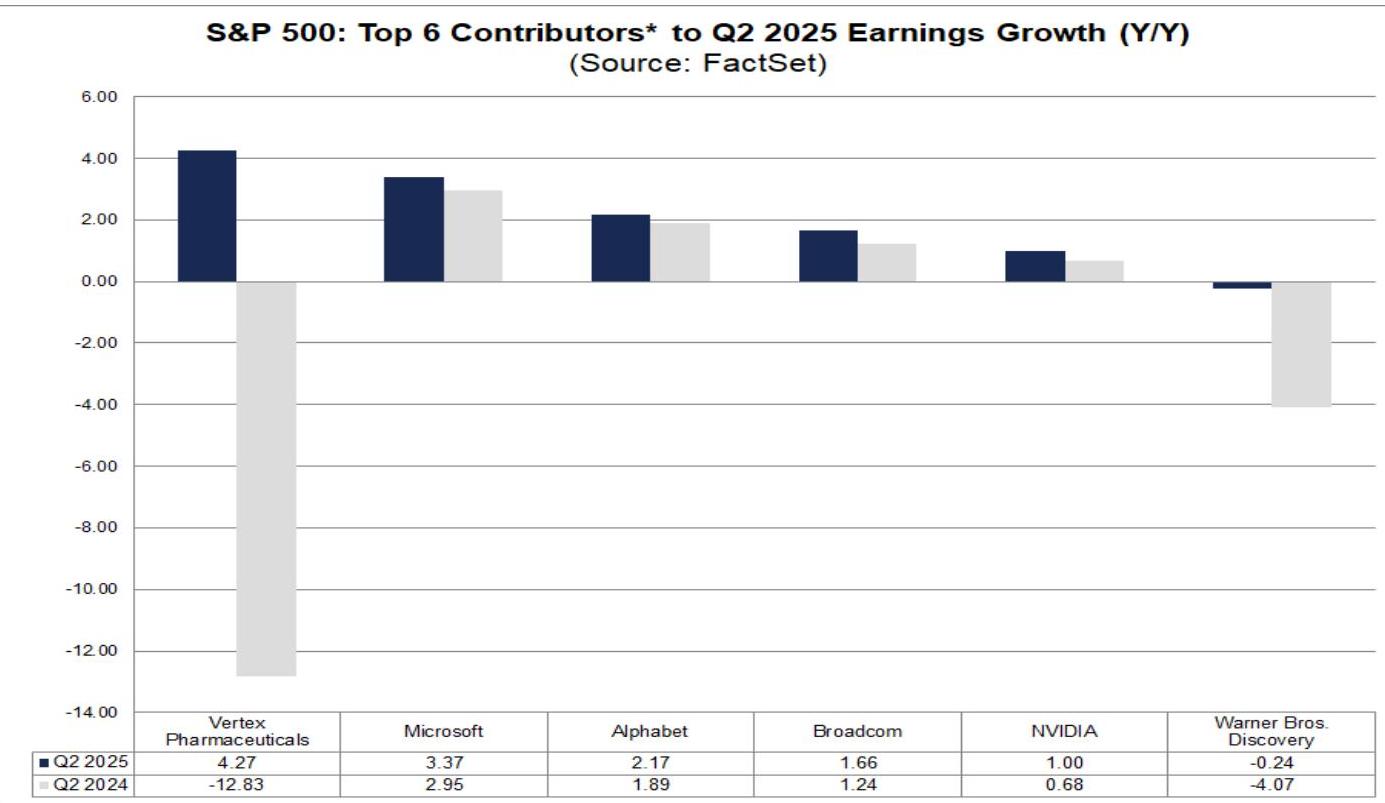
- The top six contributors to S&P 500 Q2 2025 EPS year-over-year growth (in order of contribution) are: Warner Bros. Discovery, NVIDIA, Vertex Pharmaceuticals, Microsoft, Broadcom, and Alphabet.
- Among these, NVIDIA, Microsoft, and Alphabet belong to the Magnificent 7 companies.
- Warner Bros. Discovery and Vertex Pharmaceuticals' strong performance benefited from a lower base in the prior year, primarily due to expenses and costs included in that period.
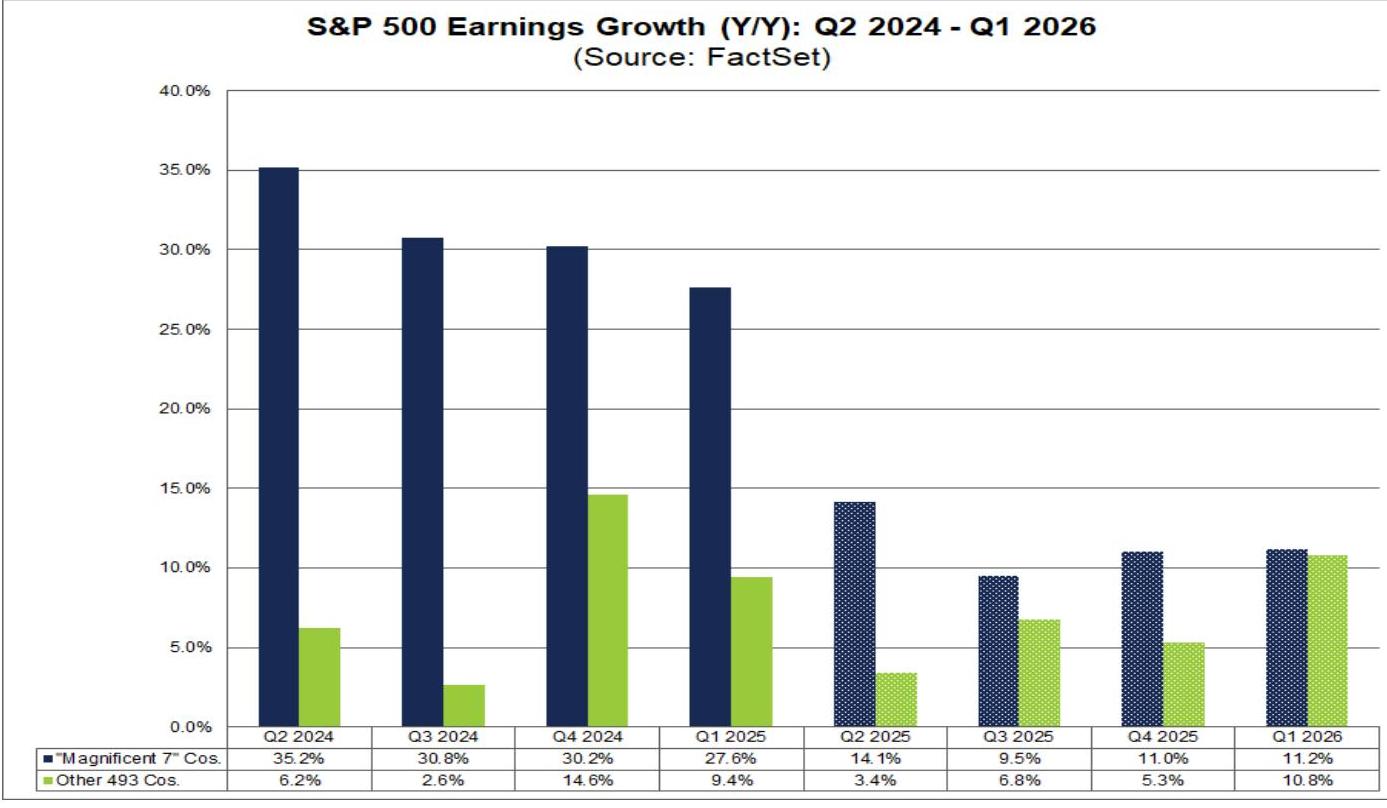
- Overall, the Magnificent 7 companies are expected to achieve 14.1% year-over-year growth in Q2 2025.
- Excluding these seven companies, the remaining S&P 500 companies (493 companies) are expected to have a blended earnings growth rate of 3.4%.
- Looking ahead, analysts expect the Magnificent 7 companies' earnings growth to slow in the next three quarters compared to Q2 2025.
- From Q3 2025 to Q1 2026, their estimated earnings growth rates are 9.5%, 11.0%, and 11.2%, respectively.
- On the other hand, analysts expect the remaining 493 companies' earnings growth to accelerate in the next three quarters compared to Q2 2025.
- From Q3 2025 to Q1 2026, these companies are expected to have earnings growth rates of 6.8%, 5.3%, and 10.8%, respectively.
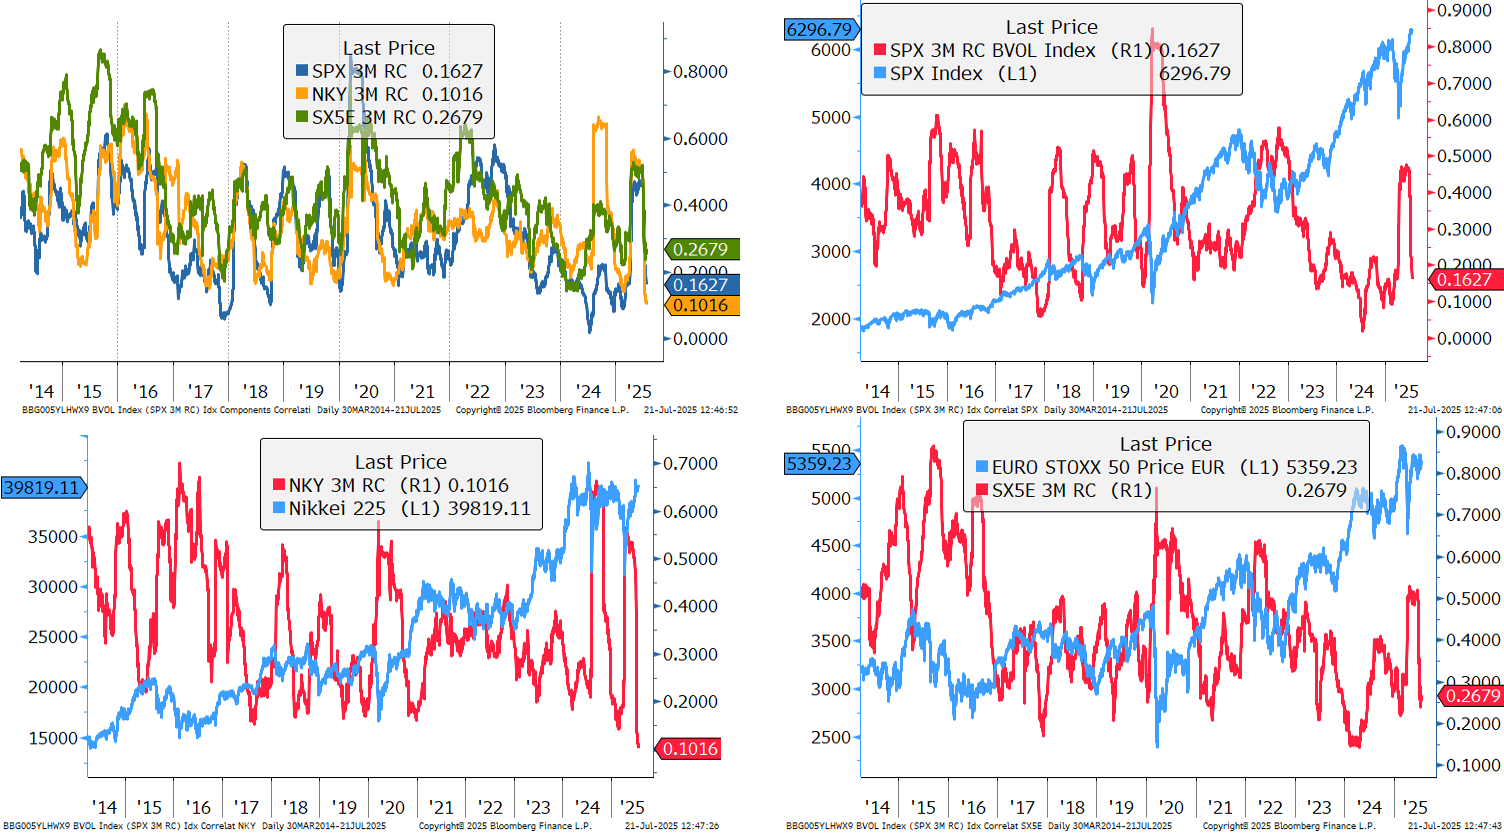
Valuation & Volatility
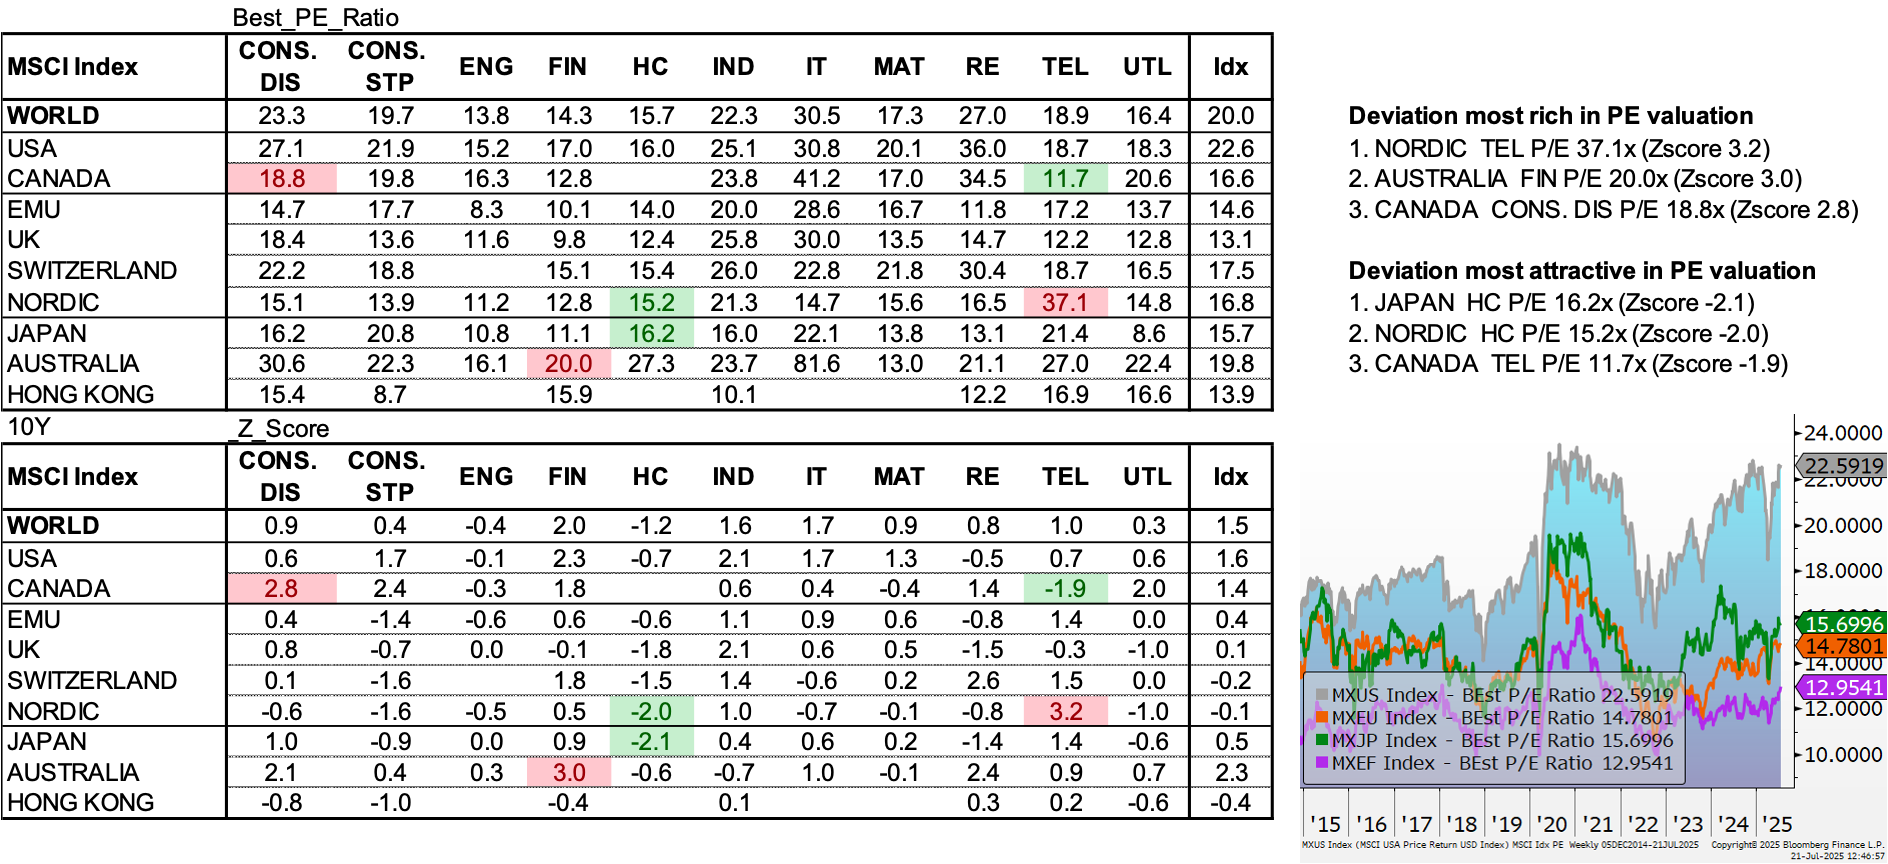
Cross Assets Valuation
Style Relative Valuation
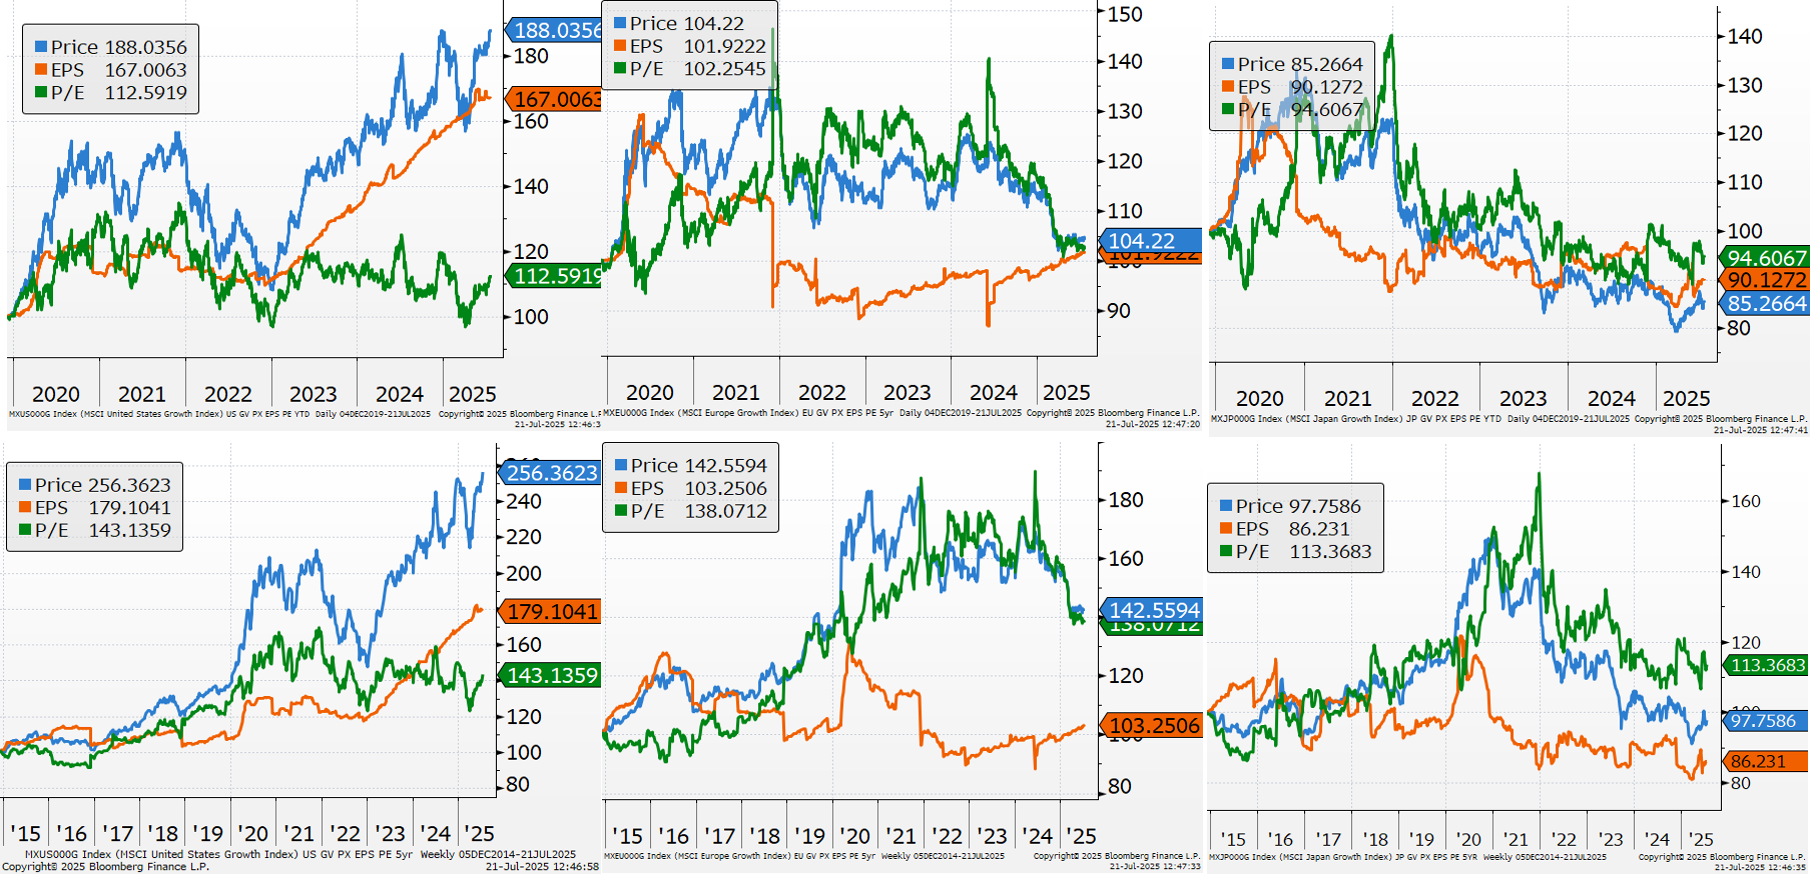
P/E Ratios
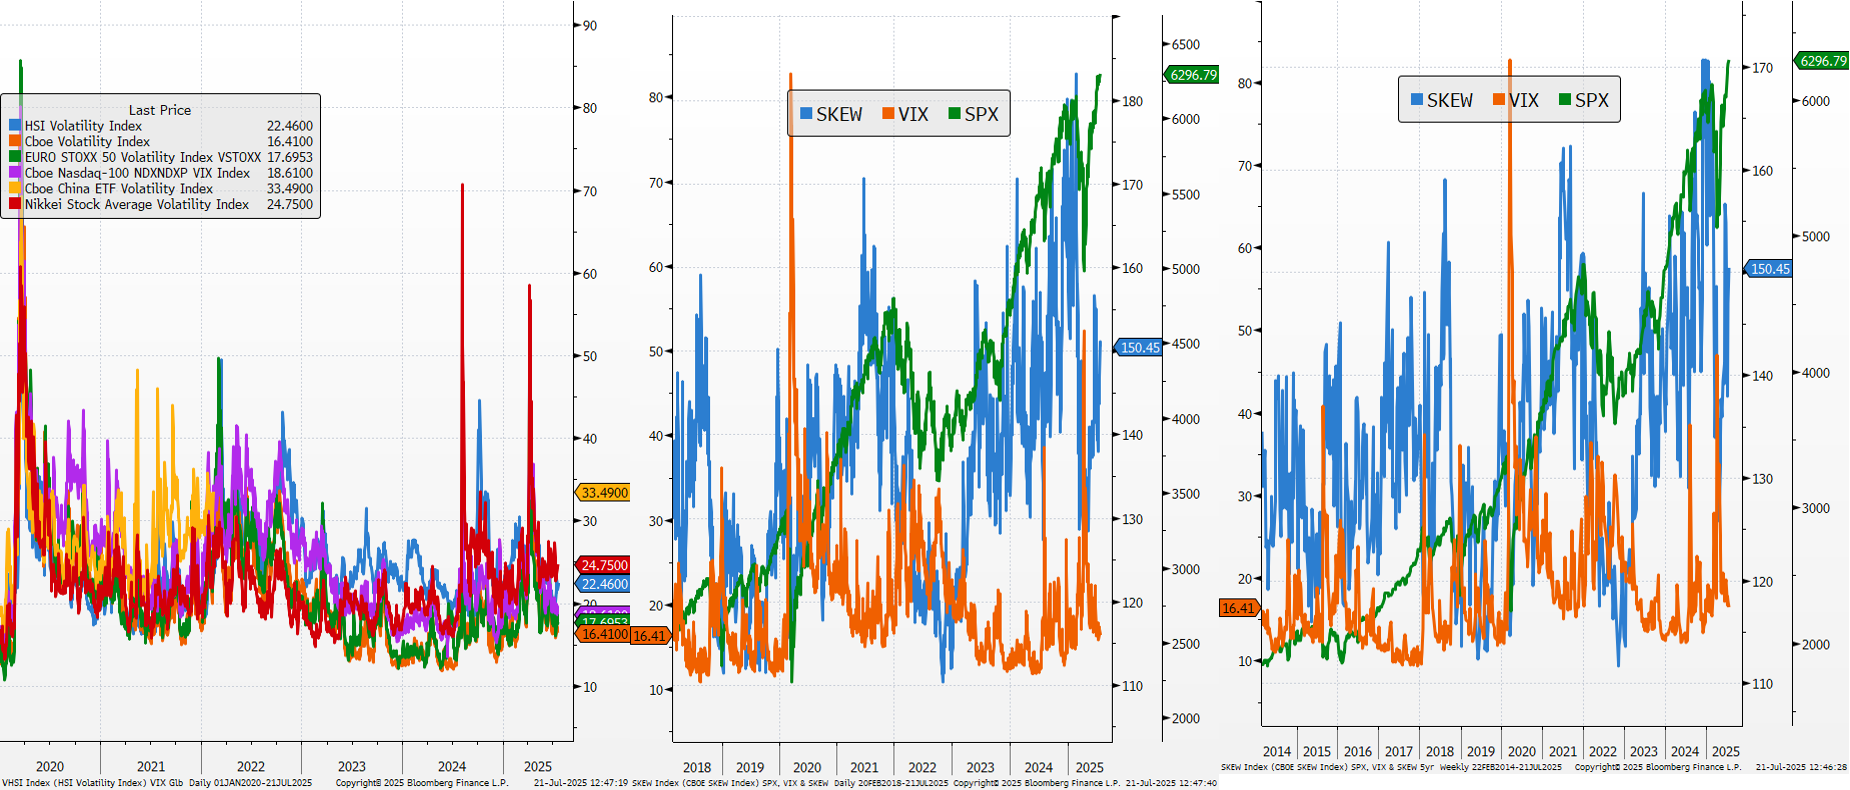
VIX and Skew
Intra Market Dynamics