202507 Global DM Monthly Recap 202507 Global DM月度回顾
This report provides a comprehensive review of global market performance, fundamental indicators, valuation metrics, and key trends across rates, credit, FX, and commodities for July 2025. 本报告全面回顾了2025年7月全球市场表现、基本面指标、估值情况以及利率、信用、外汇和大宗商品的关键趋势。
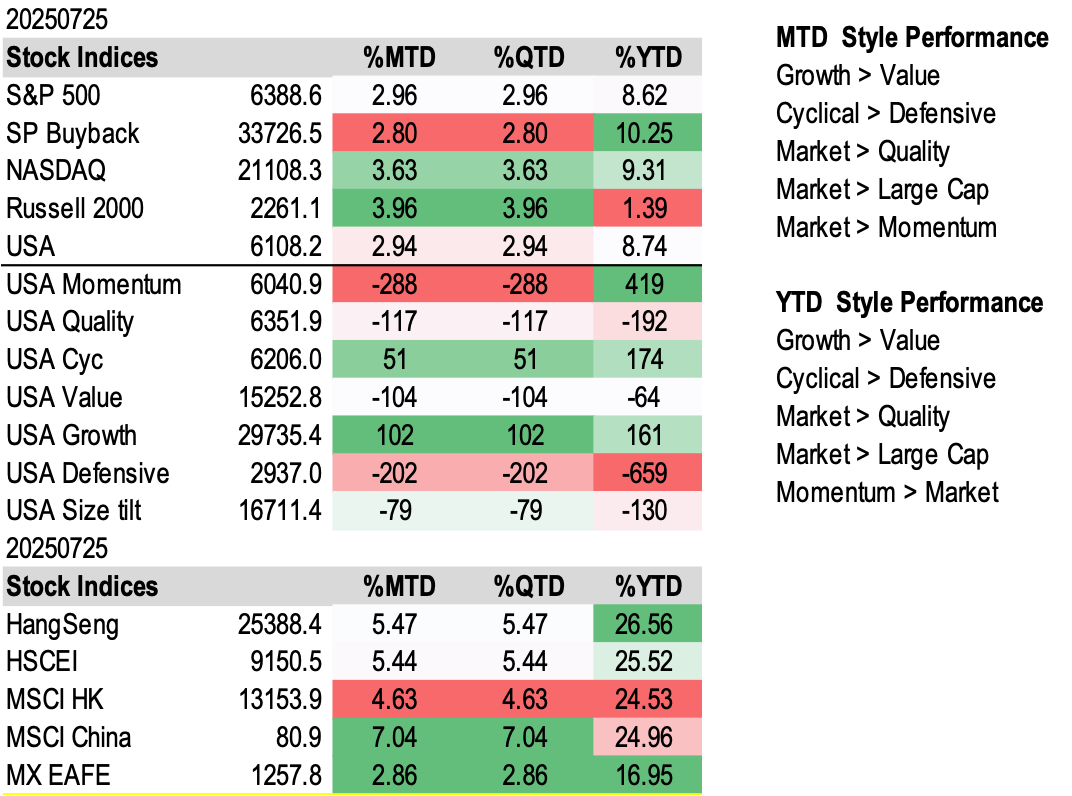
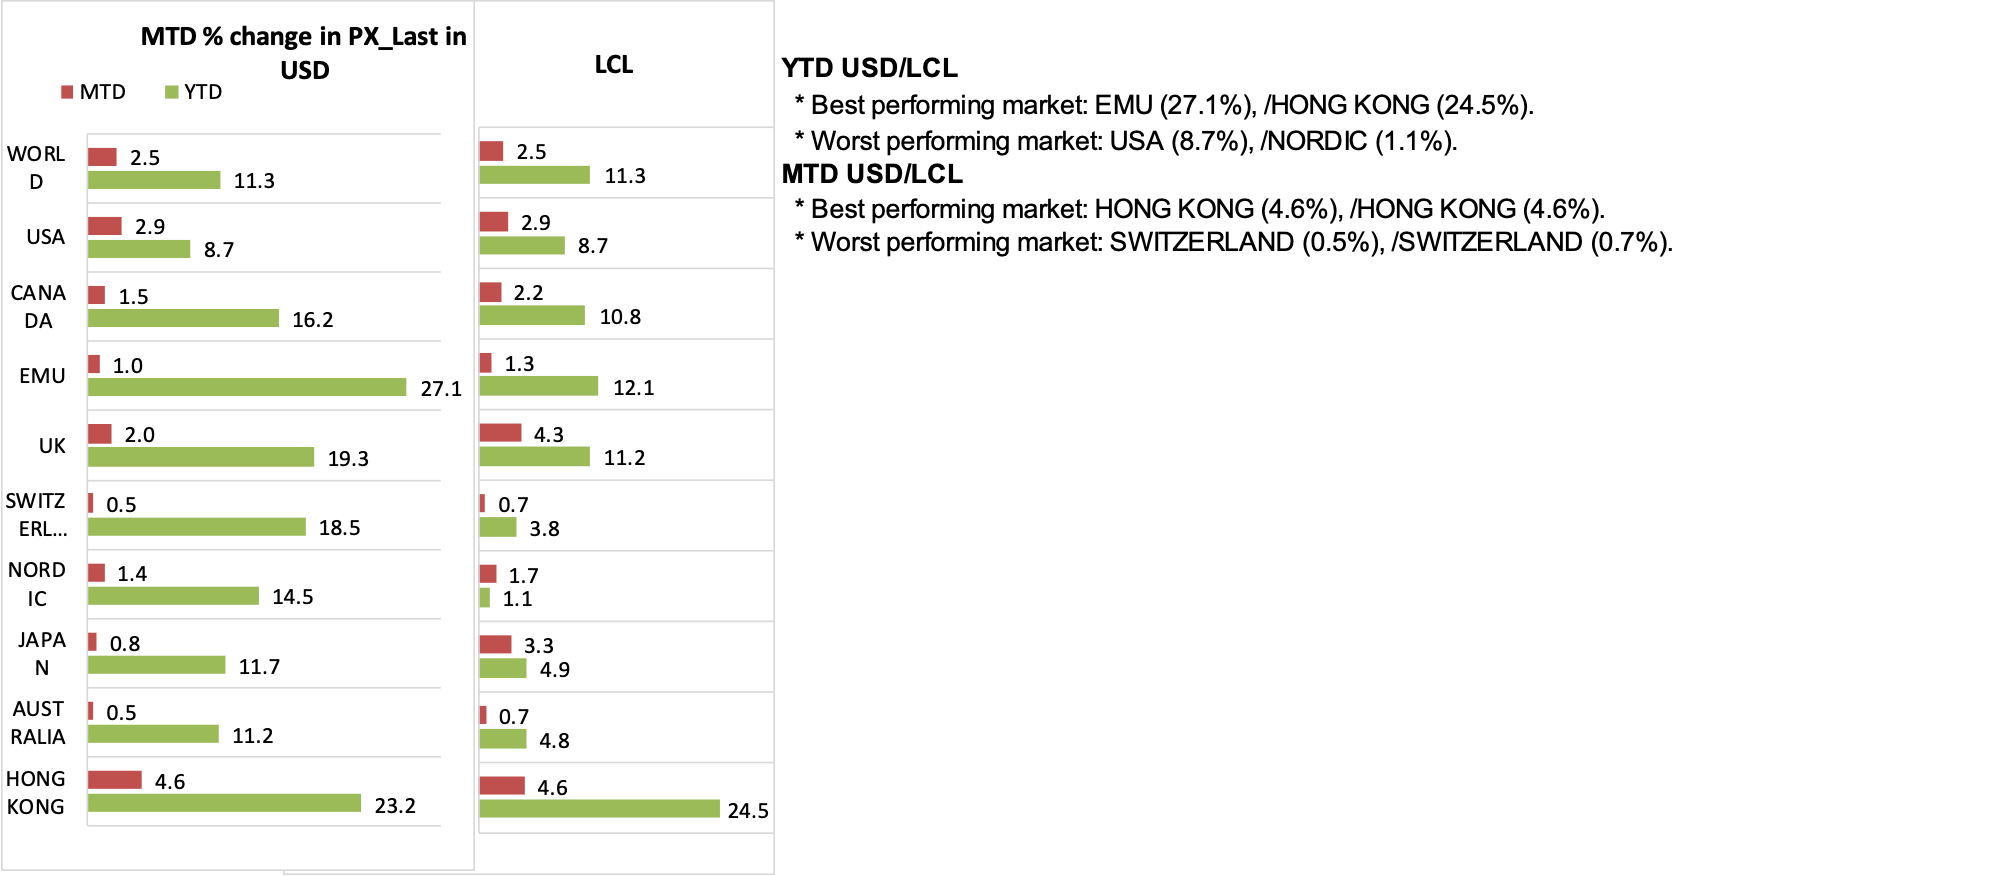
Market Performance Review 市场表现回顾
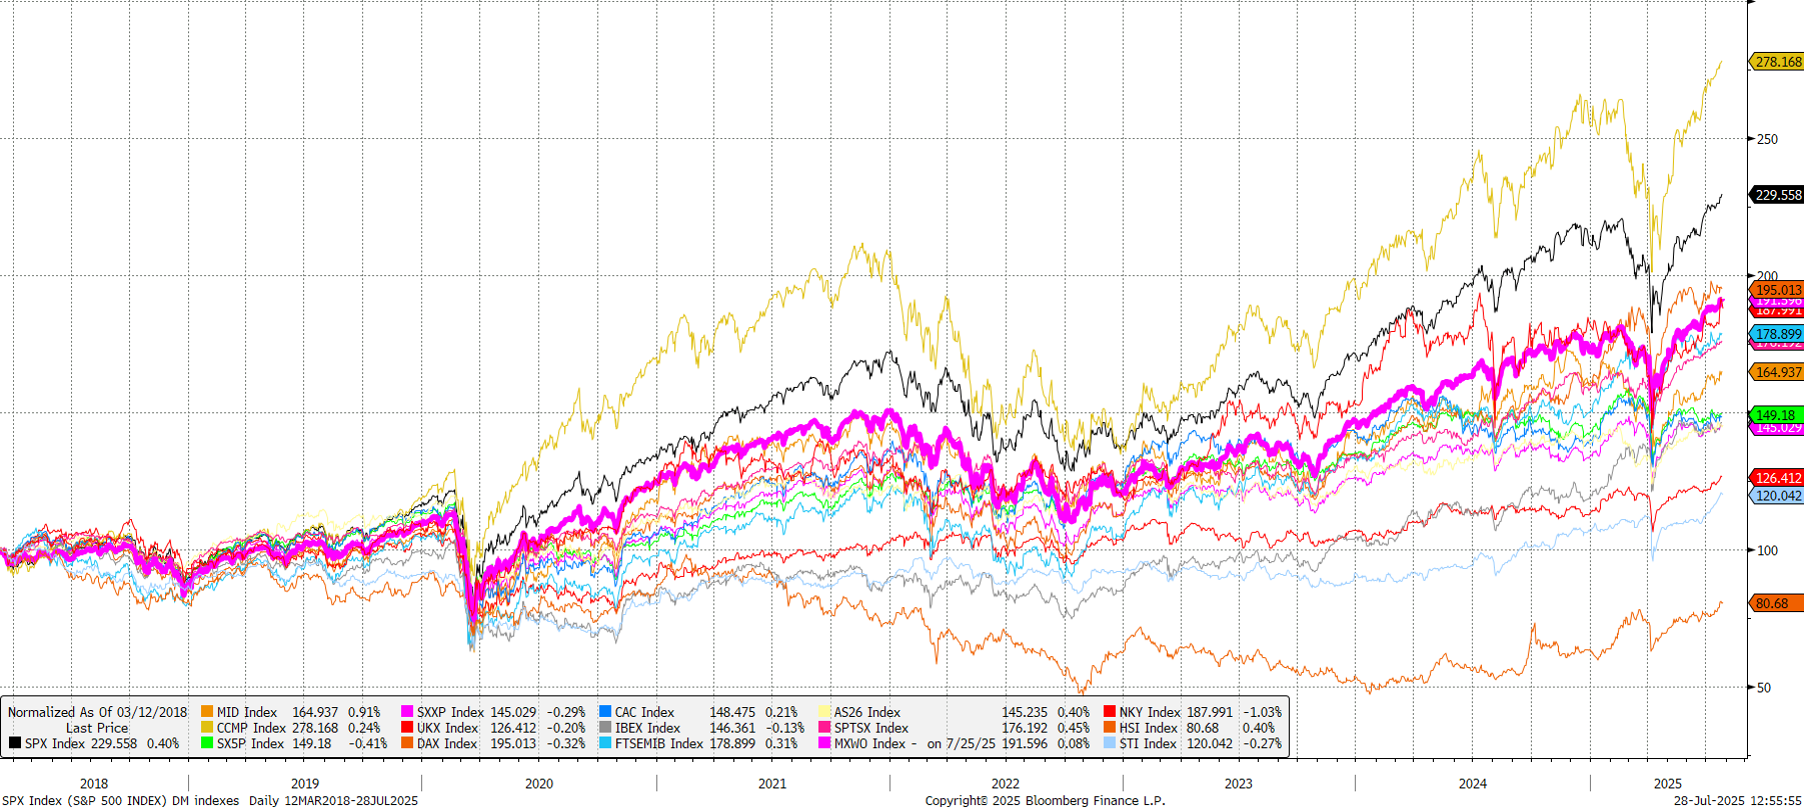
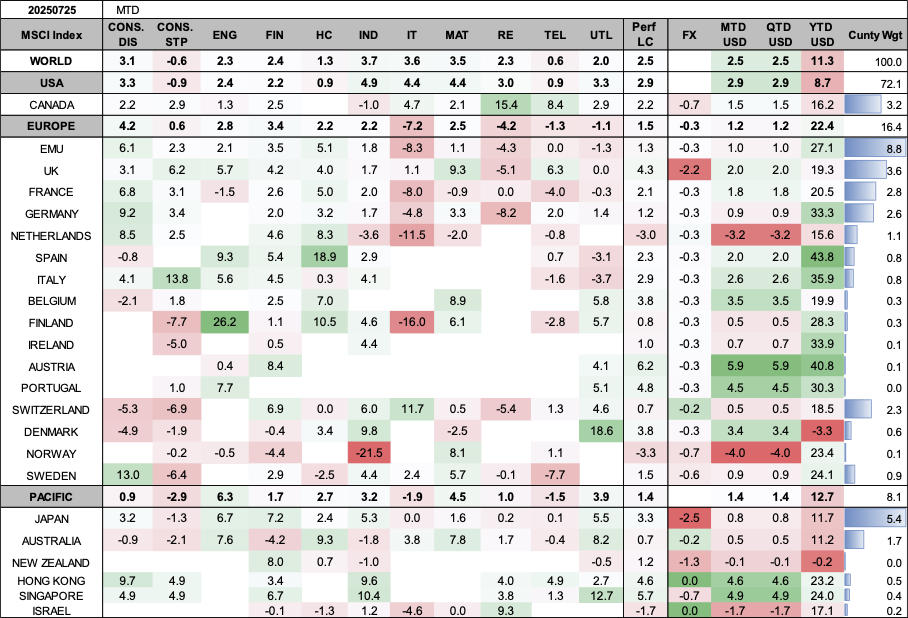
Country Indices Comparison 国家指数对比
Markets by Sectors Performance Review 市场板块表现回顾

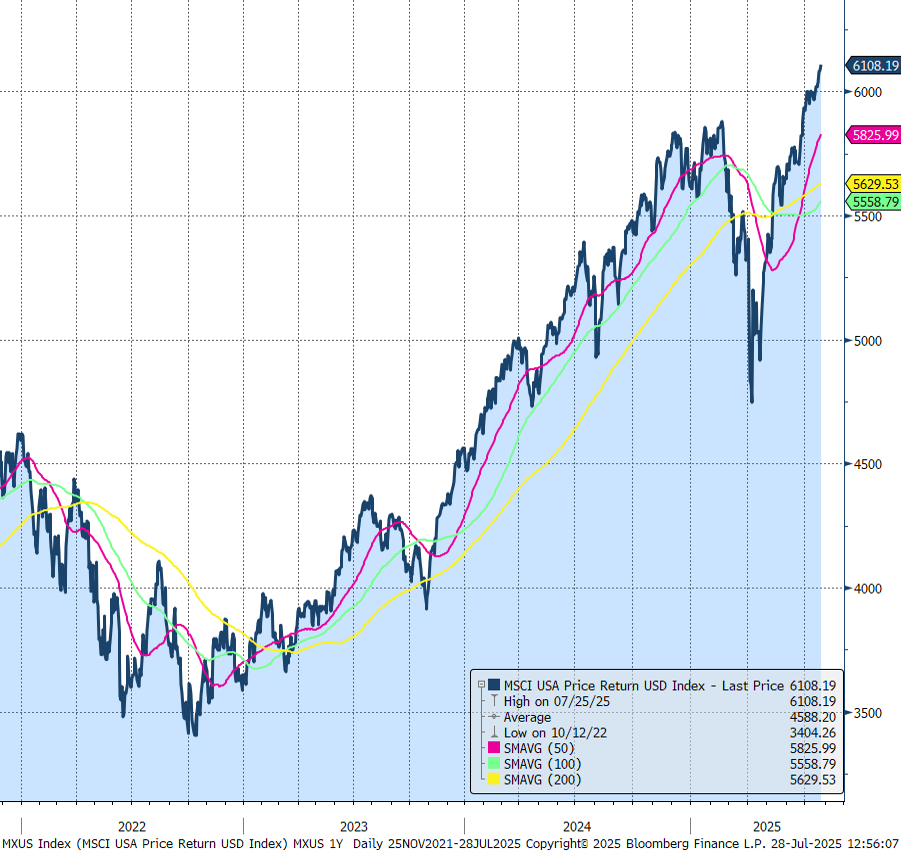
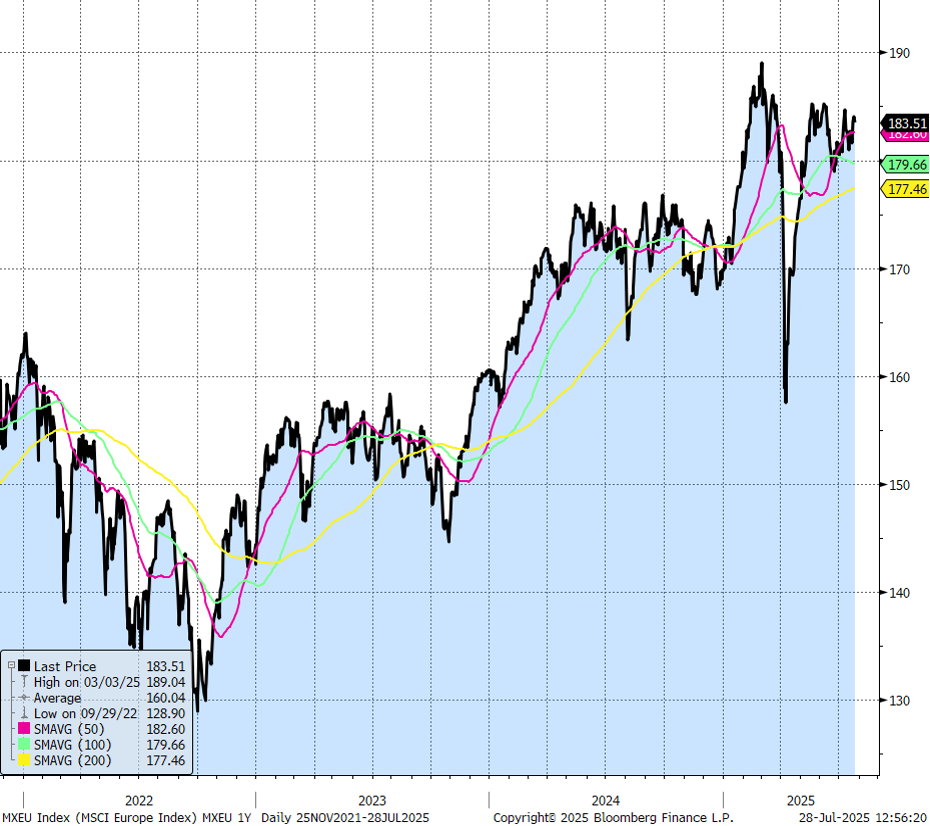
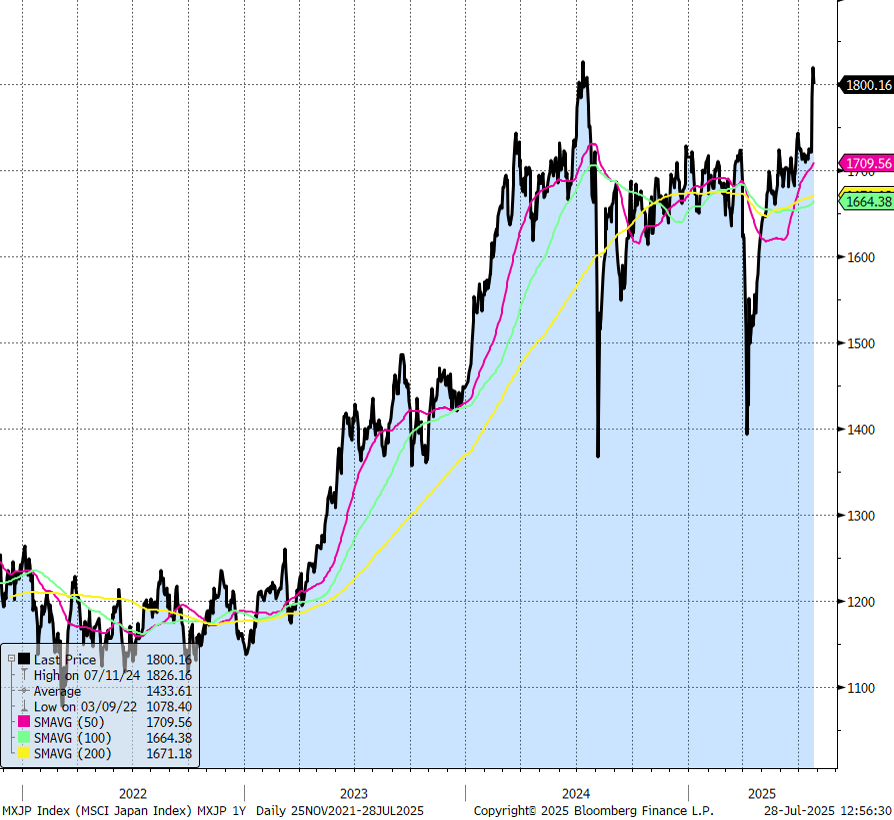
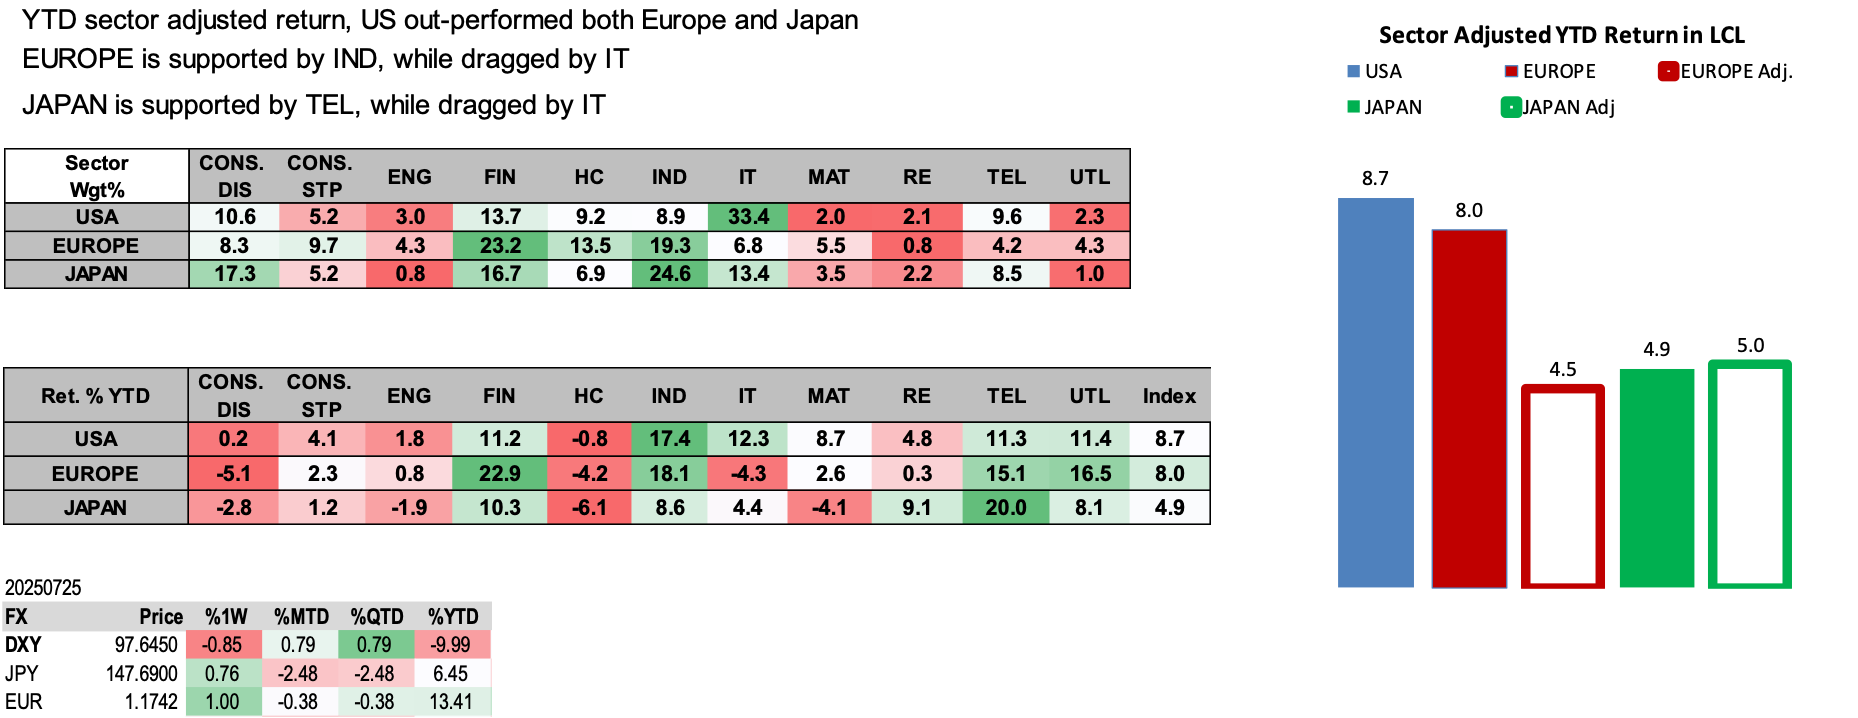
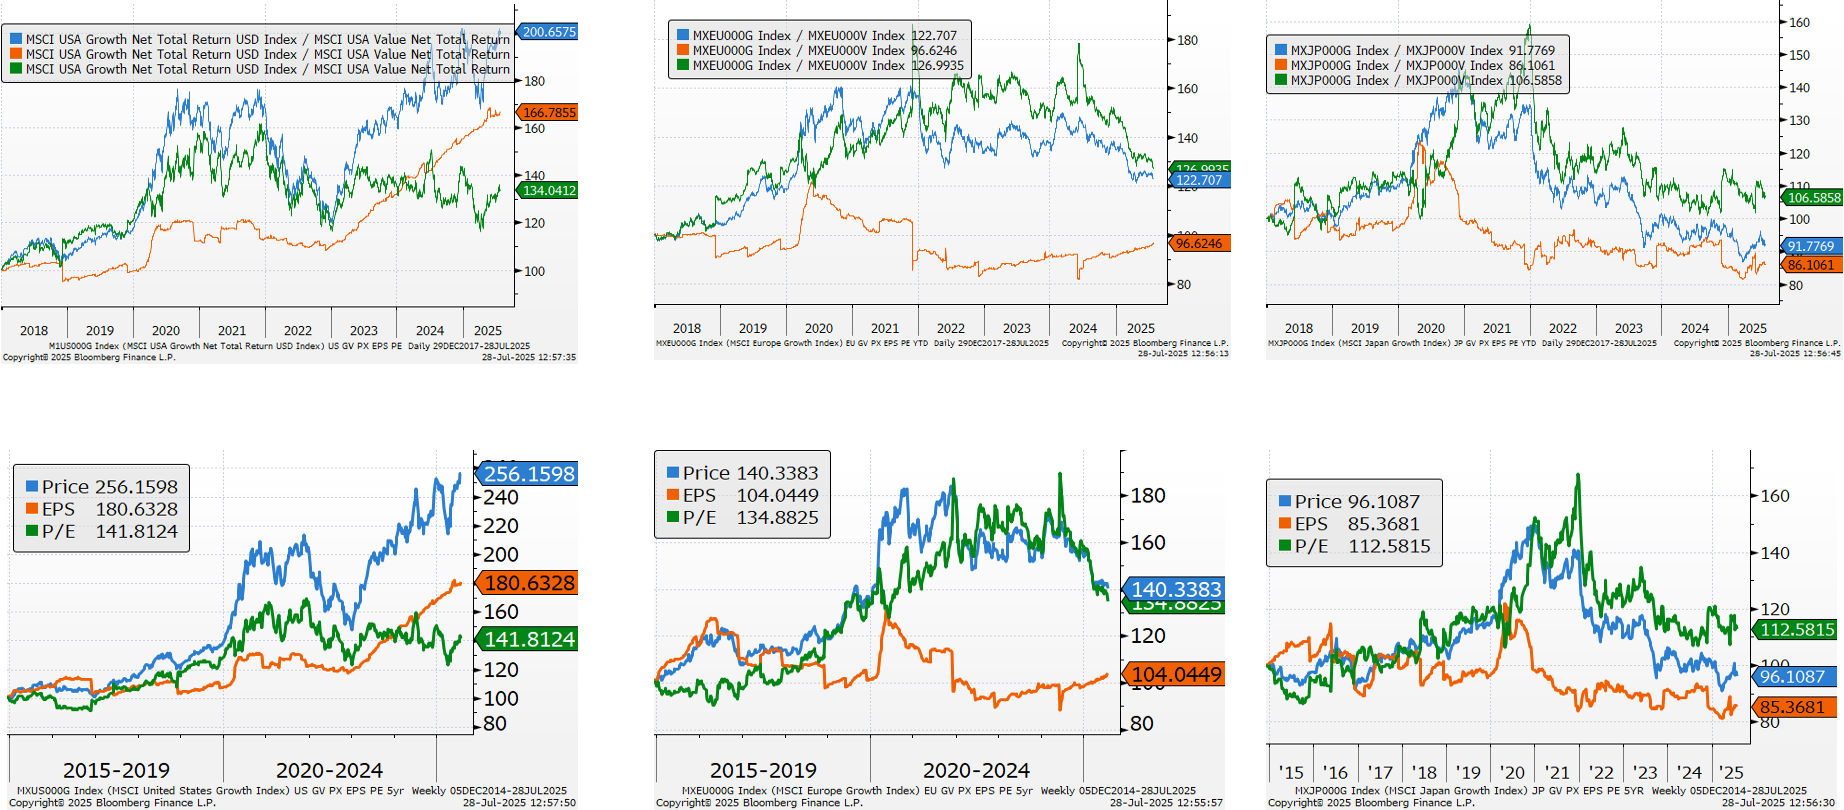
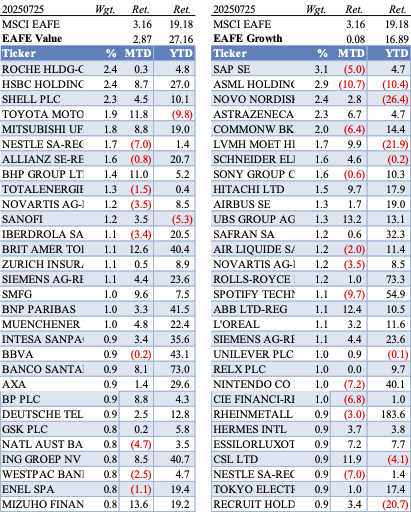
US & Europe & Japan Equity Performance Review 美欧日股市表现回顾
US
Europe
Japan
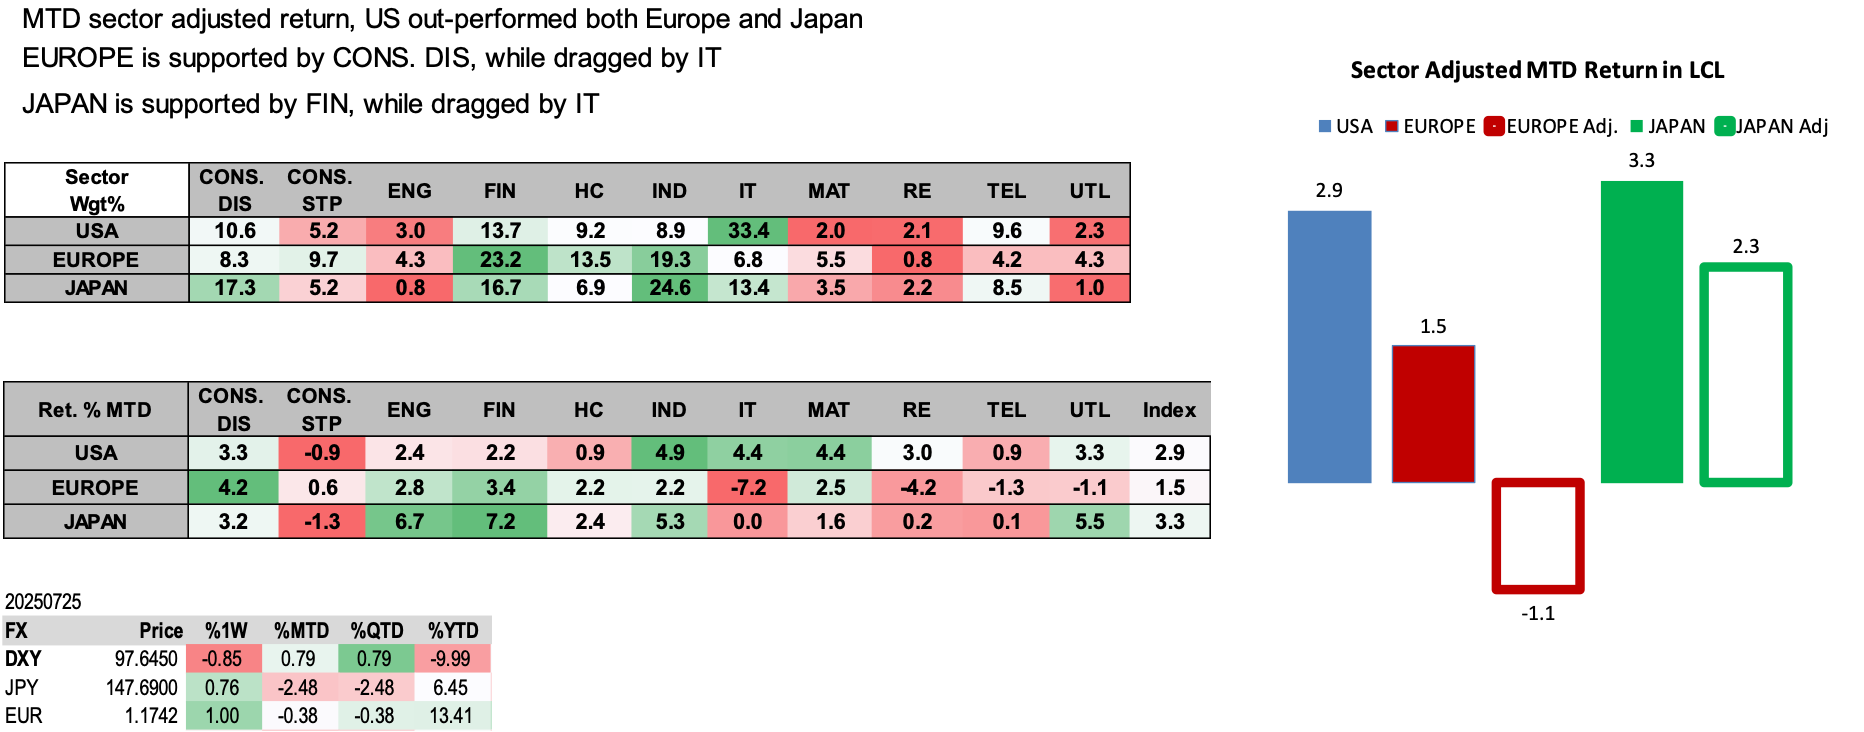
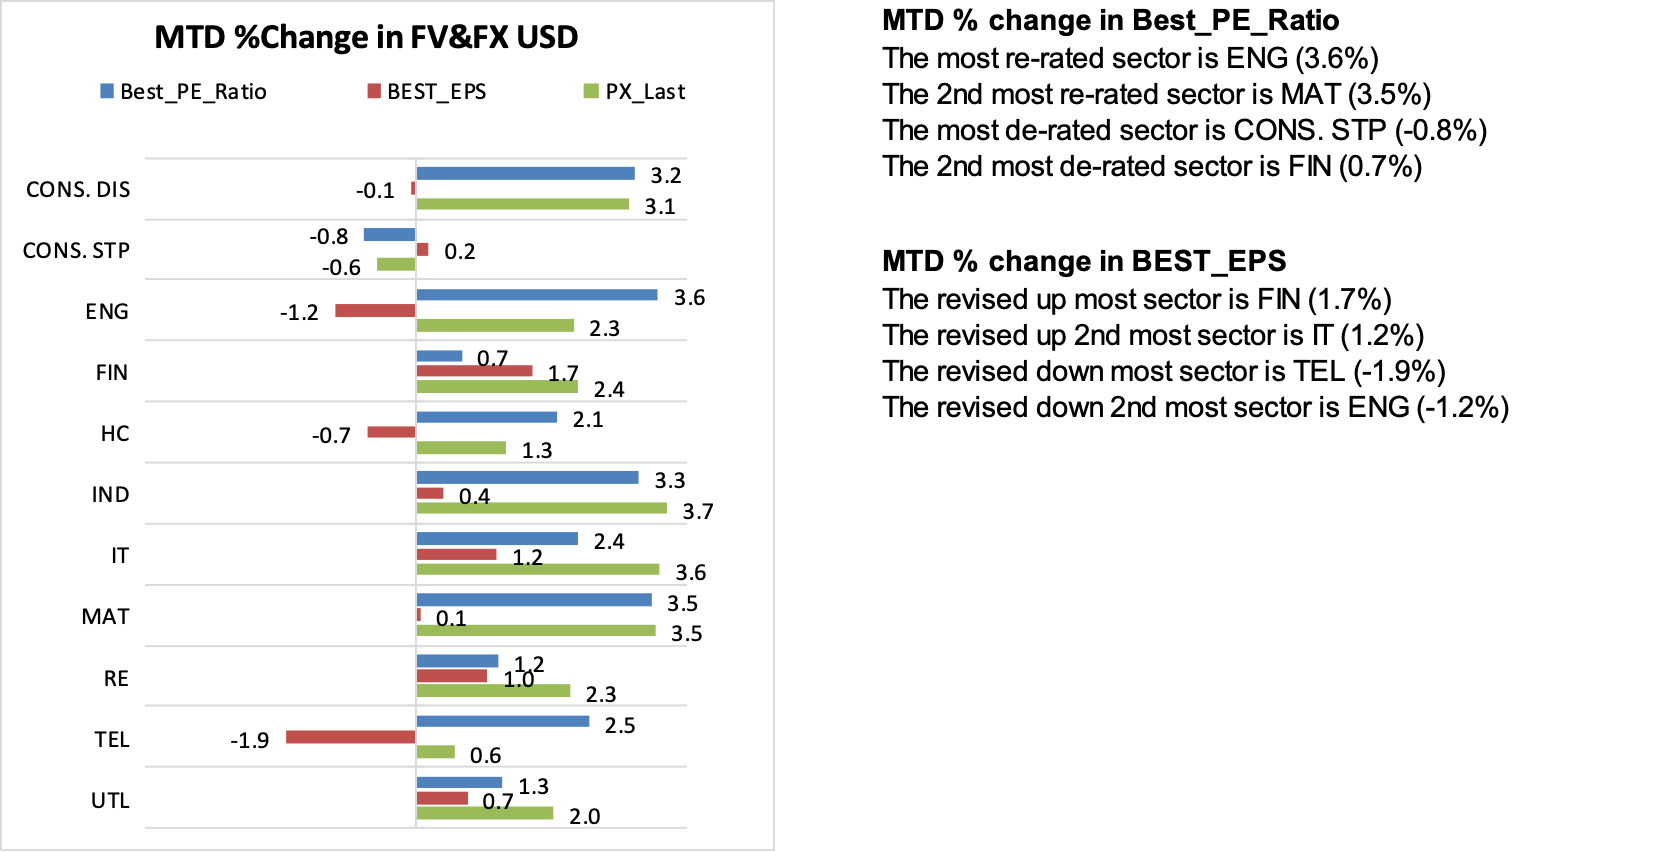
Sector Adjusted Index Return: MTD 板块调整指数回报:MTD
Sector Adjusted Index Return: YTD 板块调整指数回报:YTD
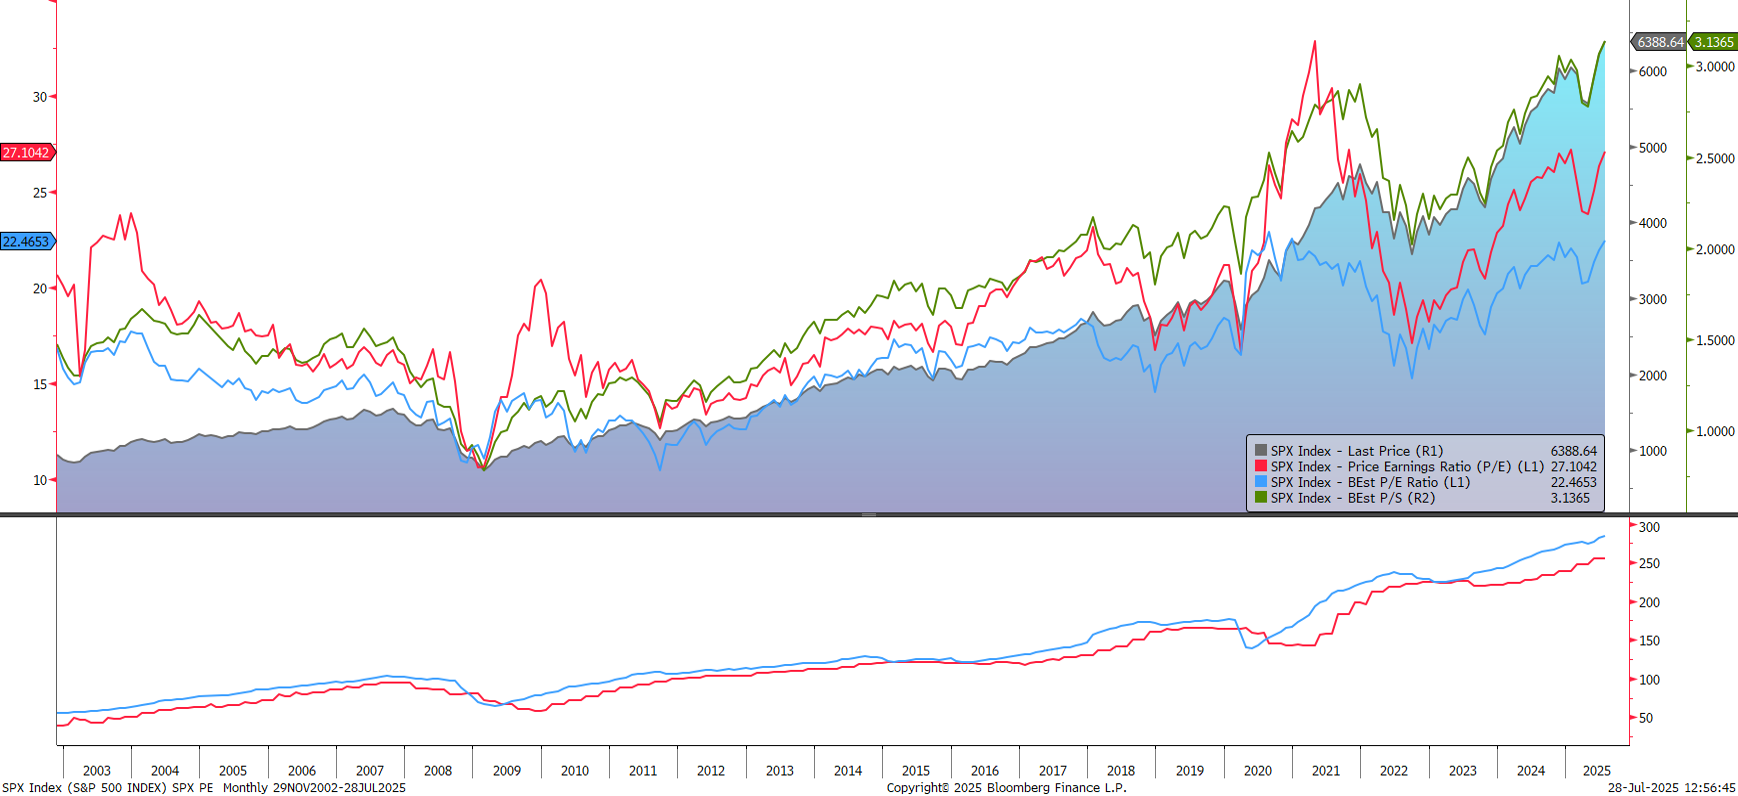
S&P 500: PE&EPS 标普500:市盈率与每股收益
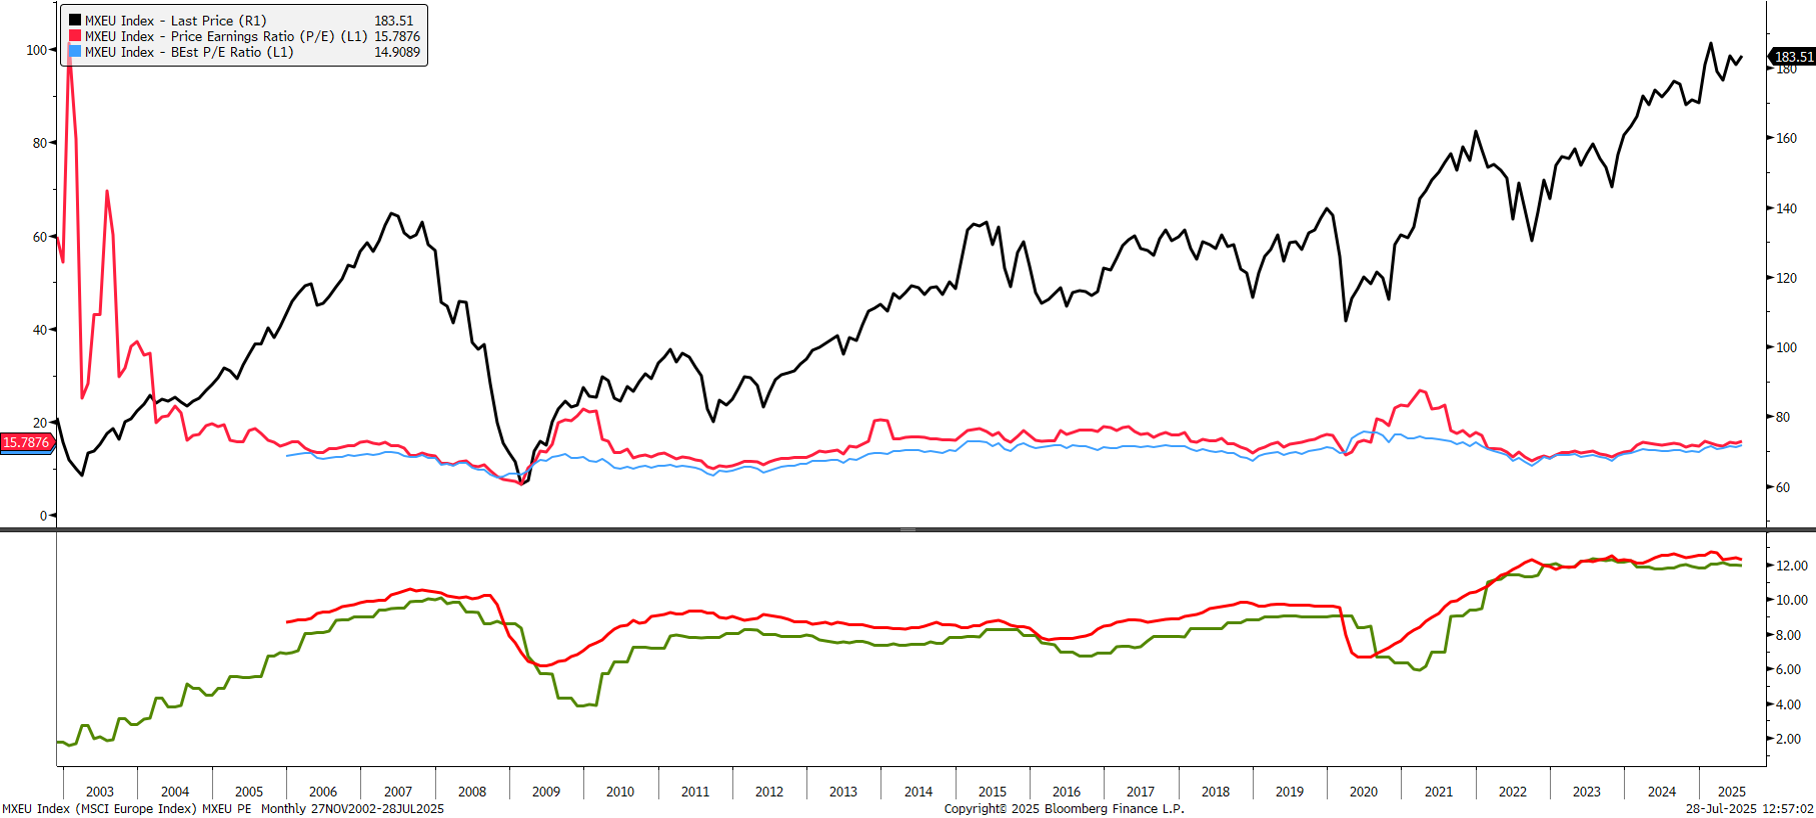
MSCI EU: PE&EPS MSCI 欧洲:市盈率与每股收益
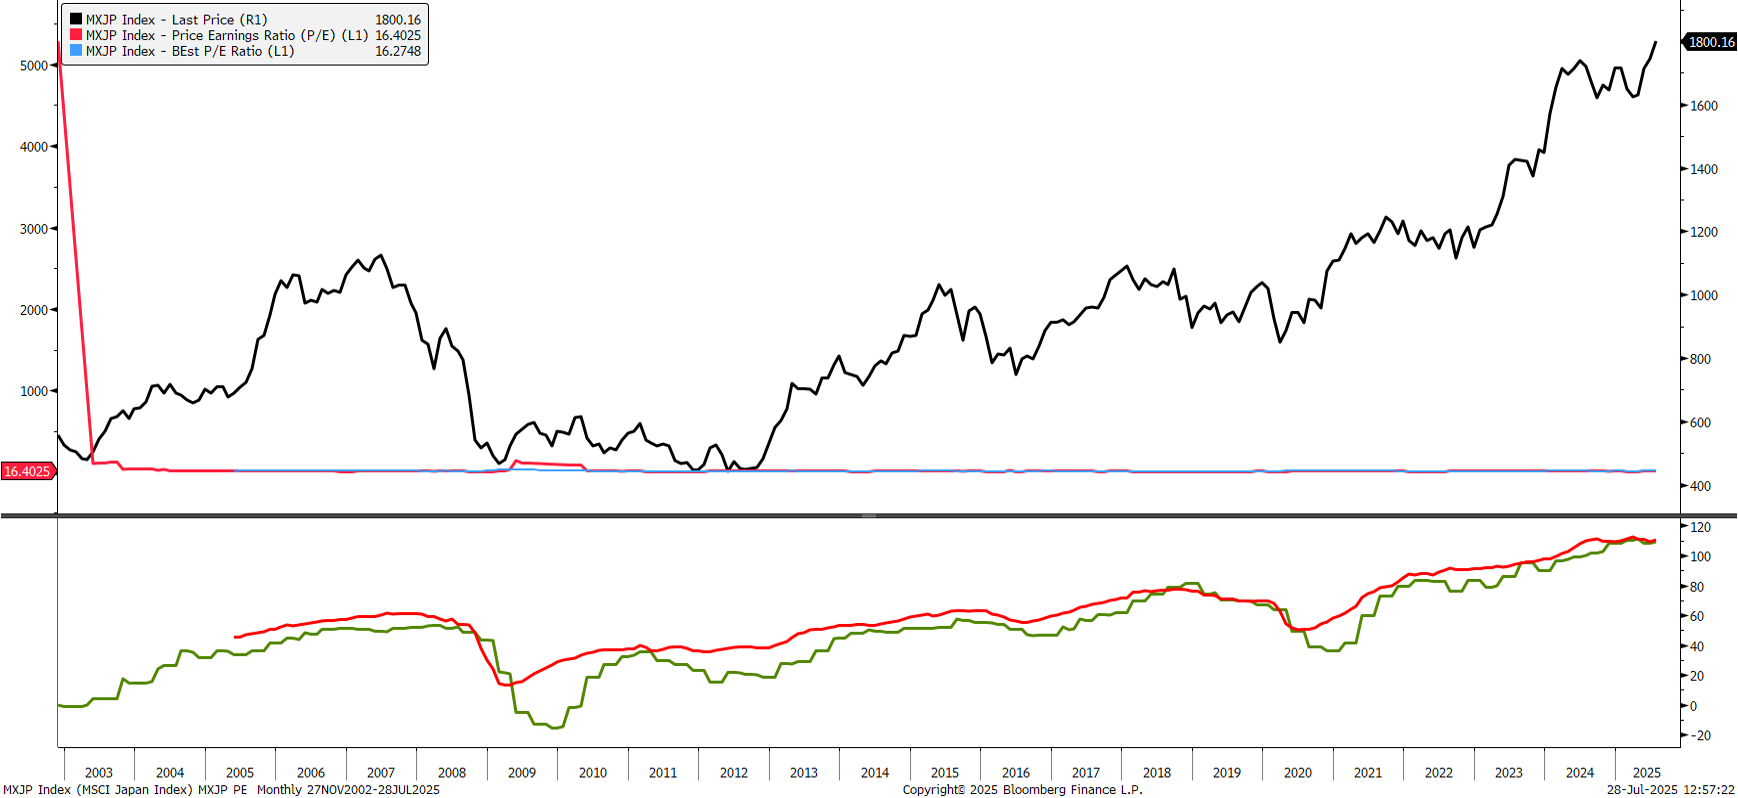
MSCI Japan: PE&EPS MSCI 日本:市盈率与每股收益
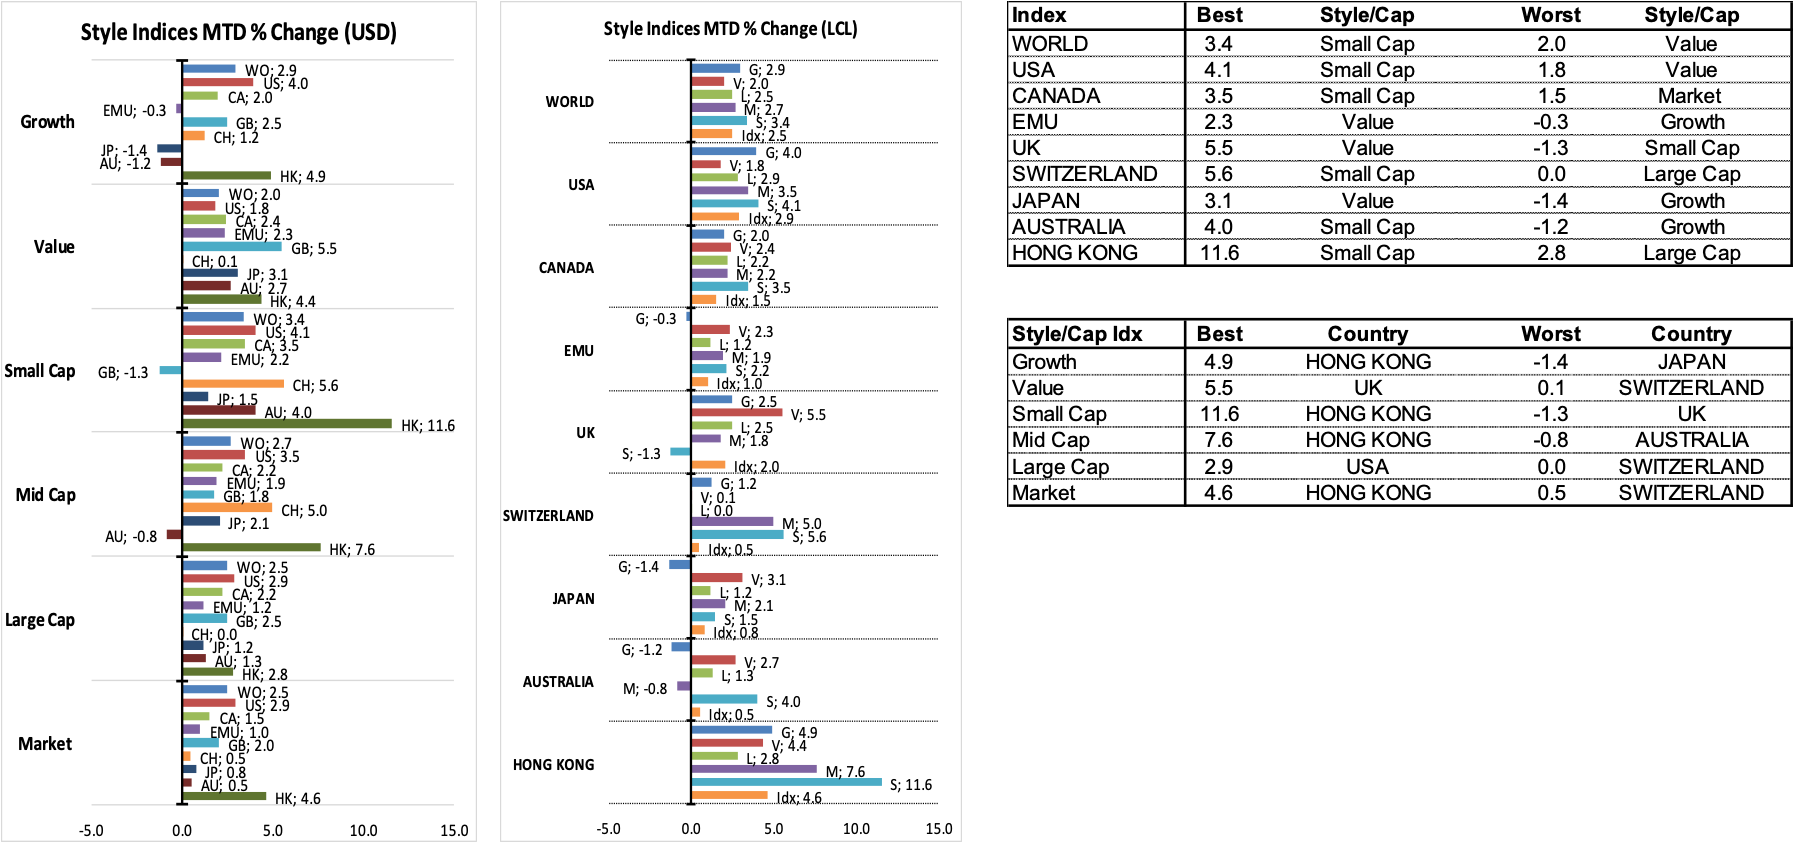
DM Style and China Indices Performance Review 发达市场风格与中国指数表现回顾
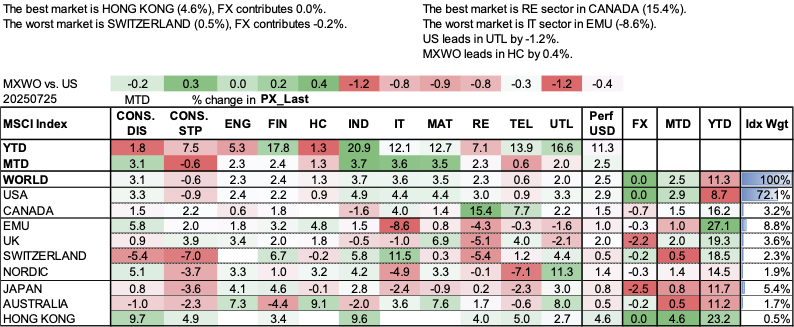
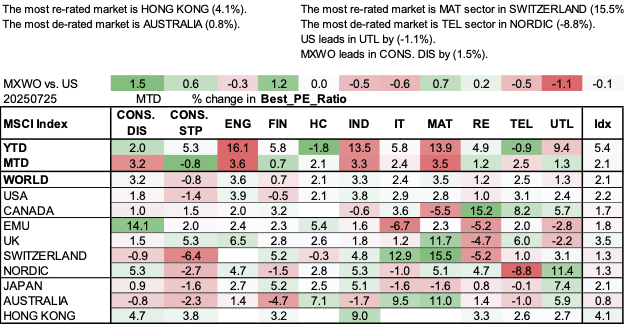
Best and Worst Performing Markets by Sectors 表现最佳和最差市场(按板块)
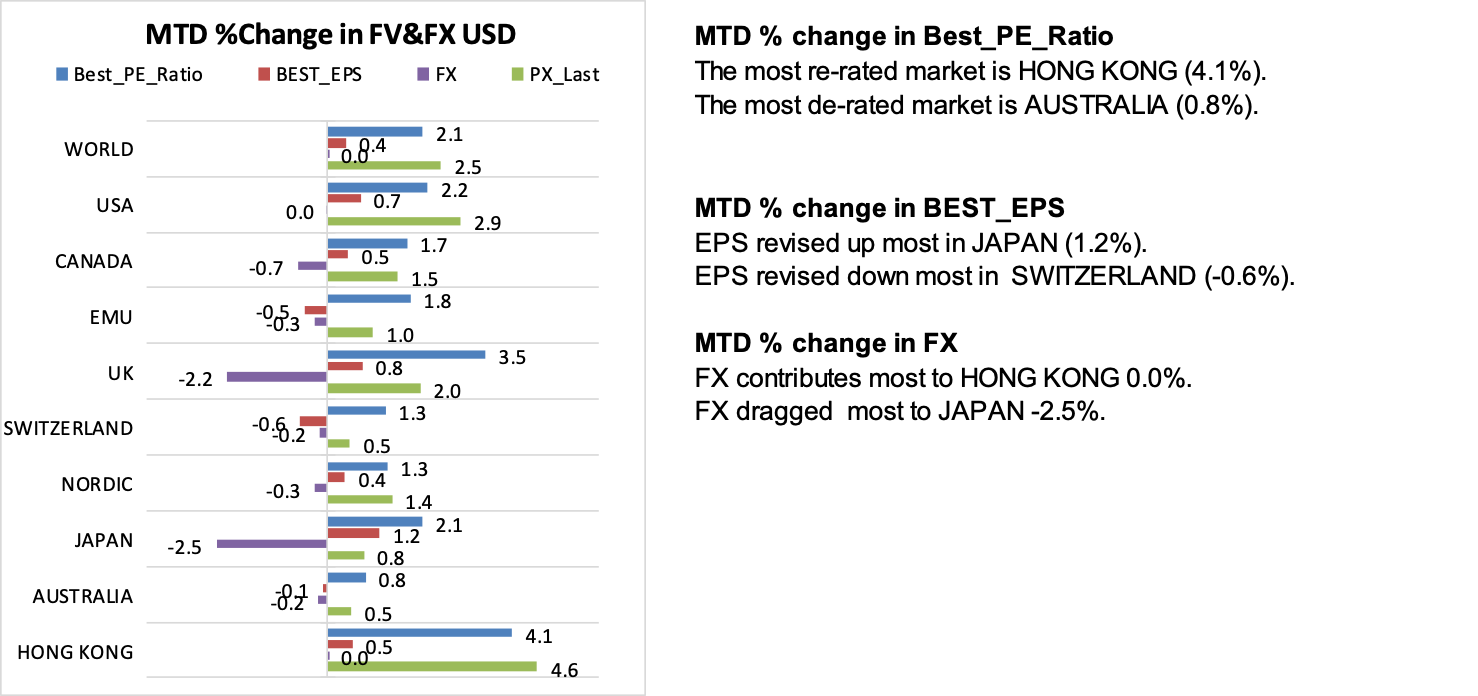
Best and Worst Performing Markets by Drivers 表现最佳和最差市场(按驱动因素)
Style Relative Performance in US, Europe and Japan 美欧日风格相对表现
Style Performance Trends in Factors and Countries 因子与国家风格表现趋势
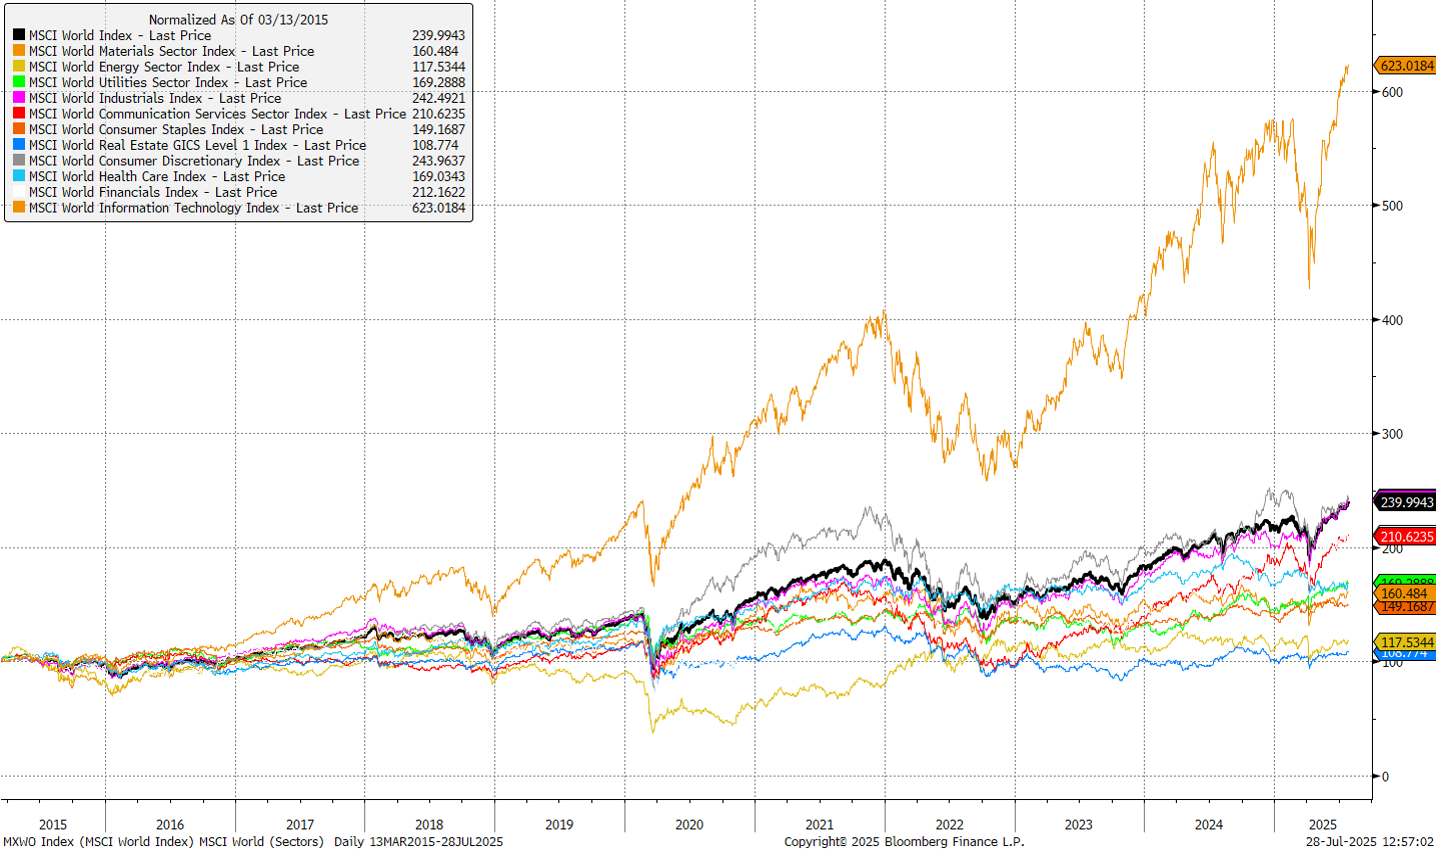
Sector Performance of MSCI World (1) MSCI 全球市场板块表现 (1)
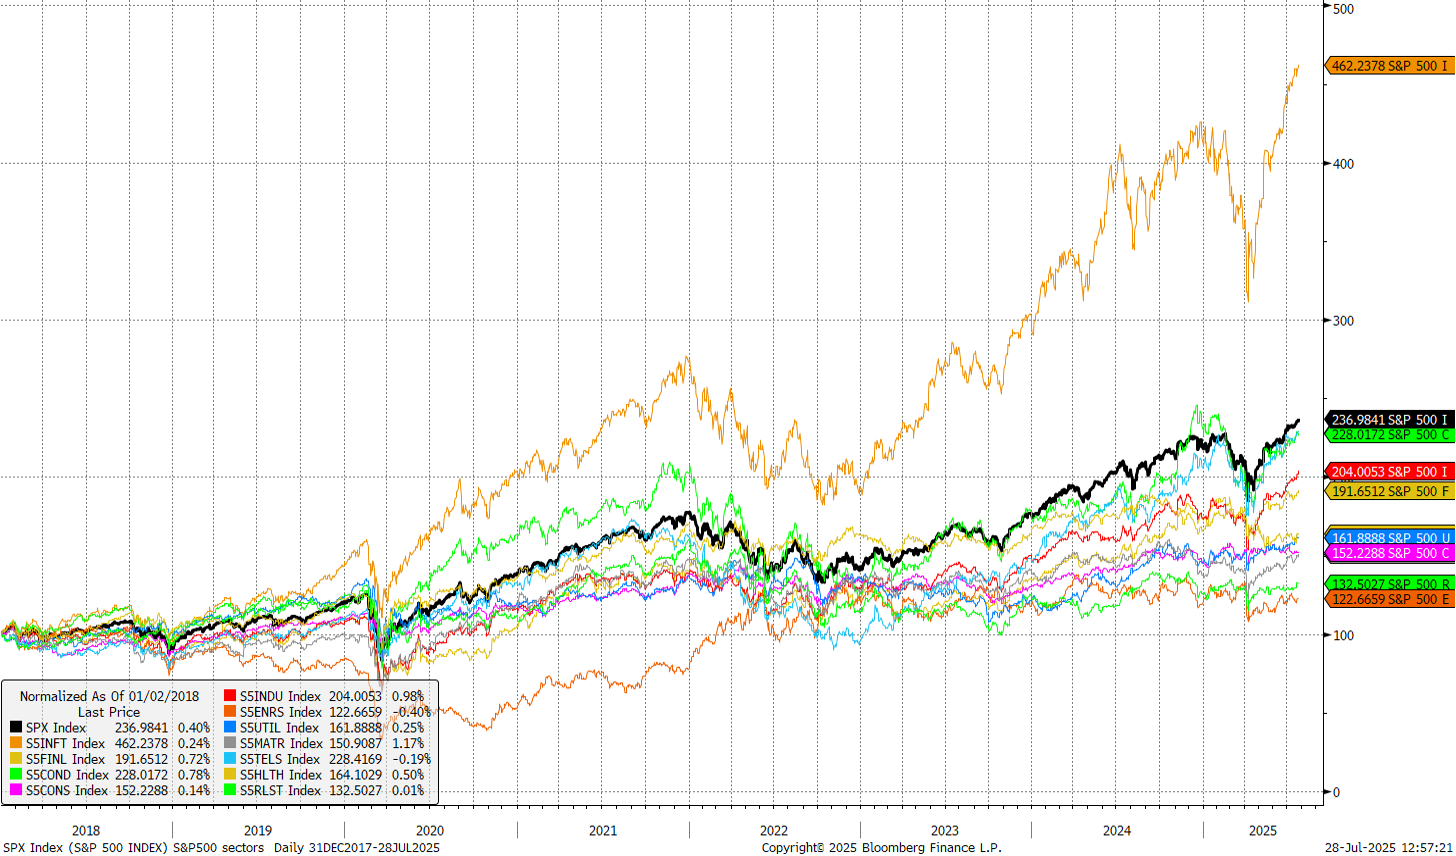
Sector Performance of the US Market 美国市场板块表现
Sector Performance of MSCI World (2) MSCI 全球市场板块表现 (2)
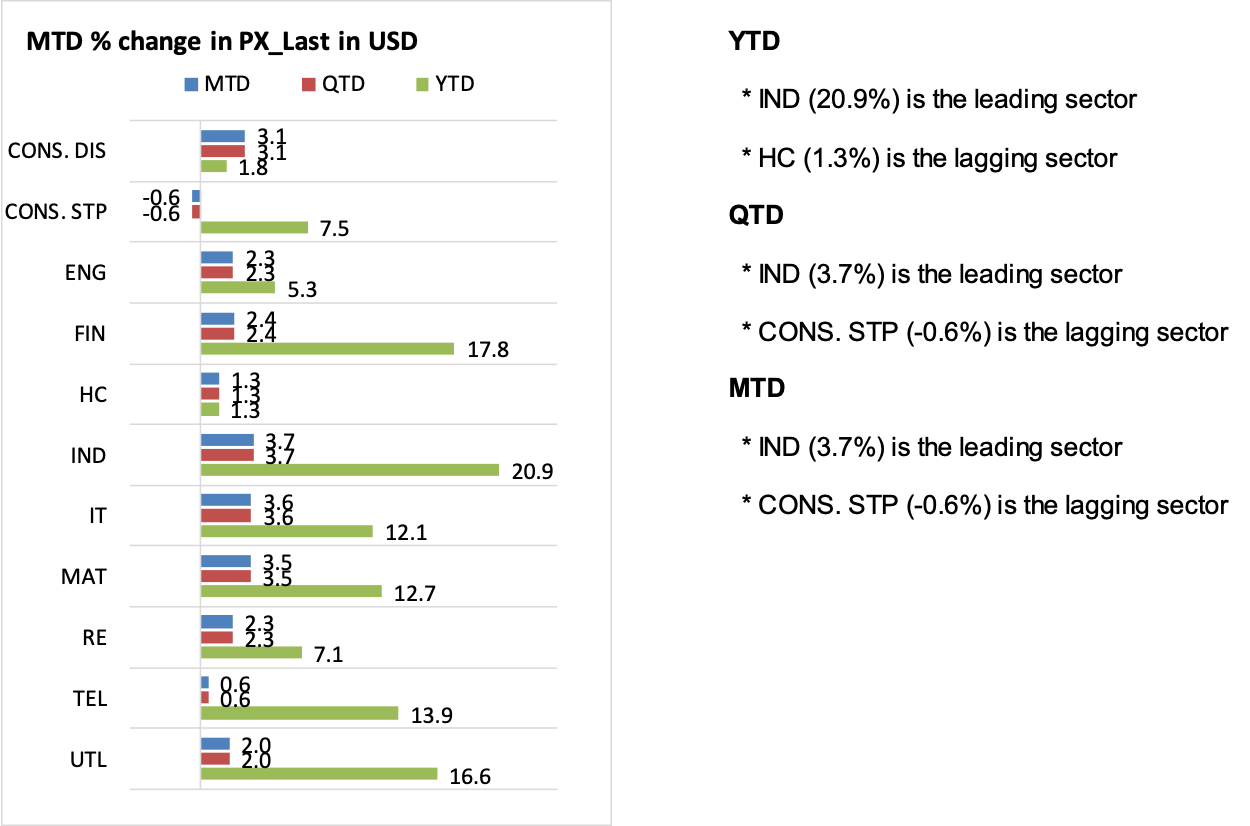
Sector Performance of MSCI World by Drivers MSCI 全球市场板块表现(按驱动因素)
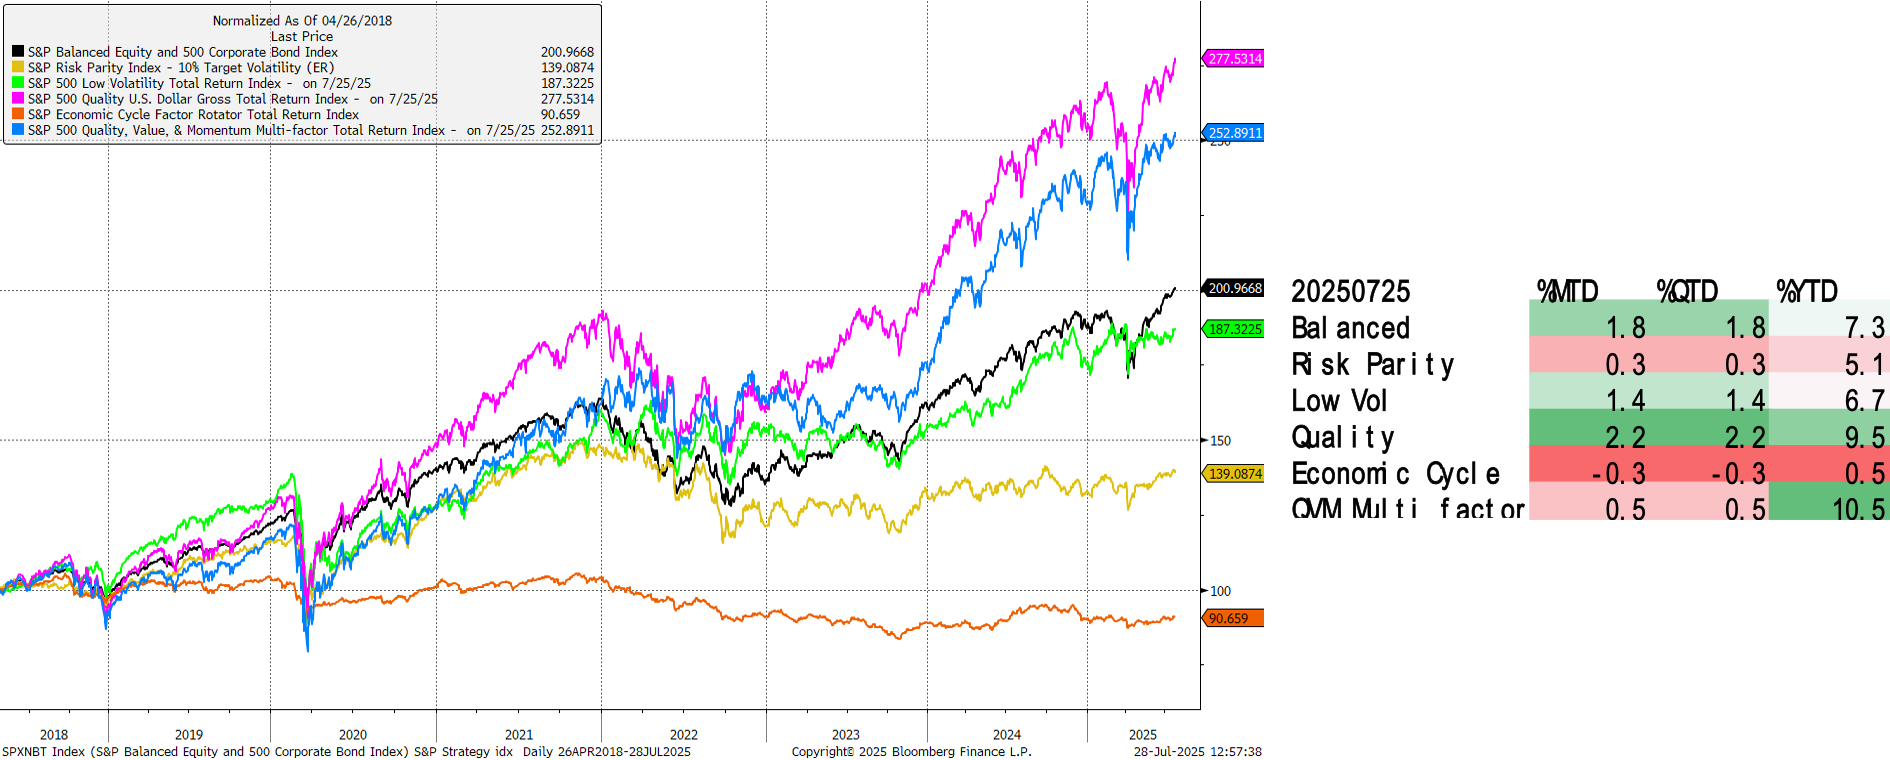
Strategies’ Performance 策略表现
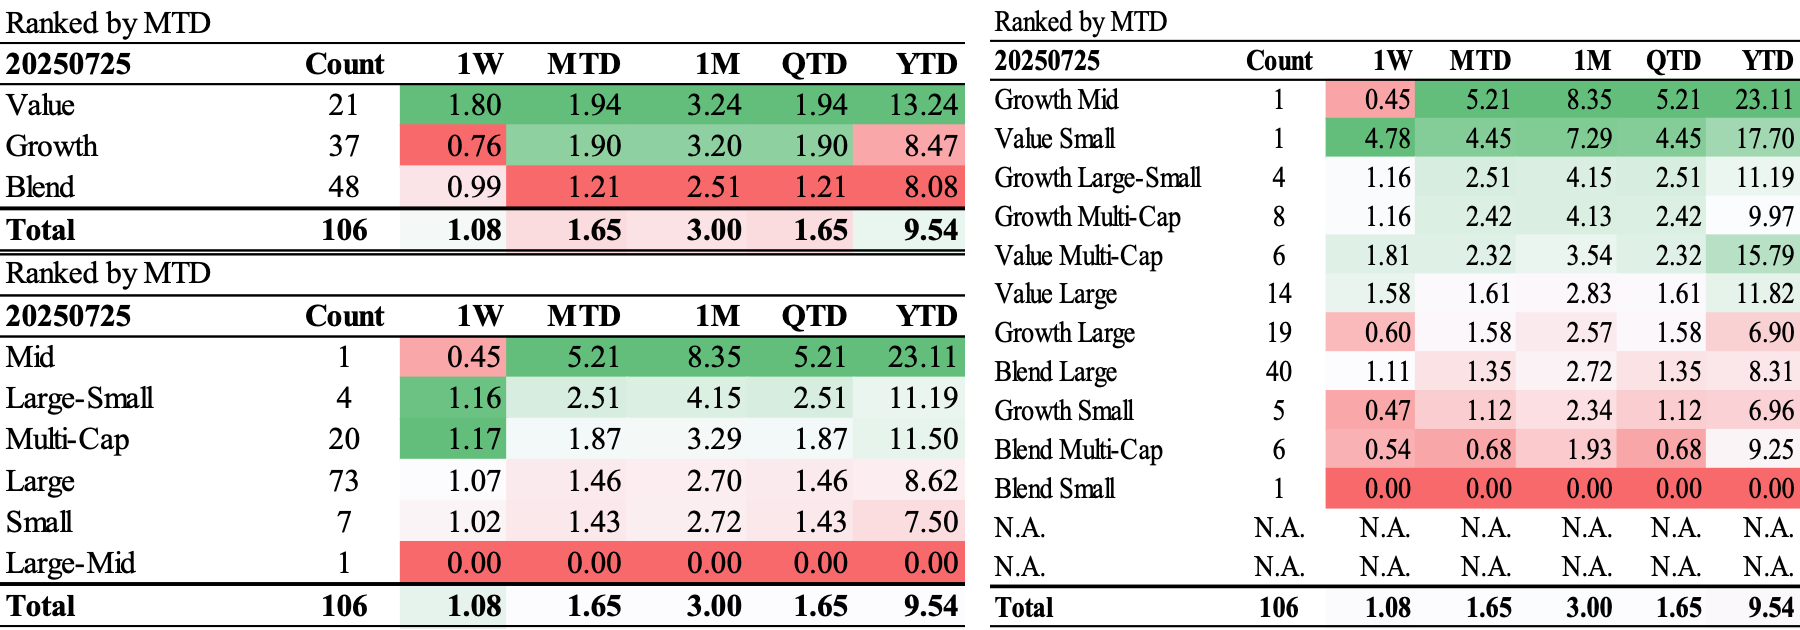
Peers Performance by Style & MCap 同业风格与市值表现
Top Weighting Stocks in Style Indices 风格指数中权重股
US
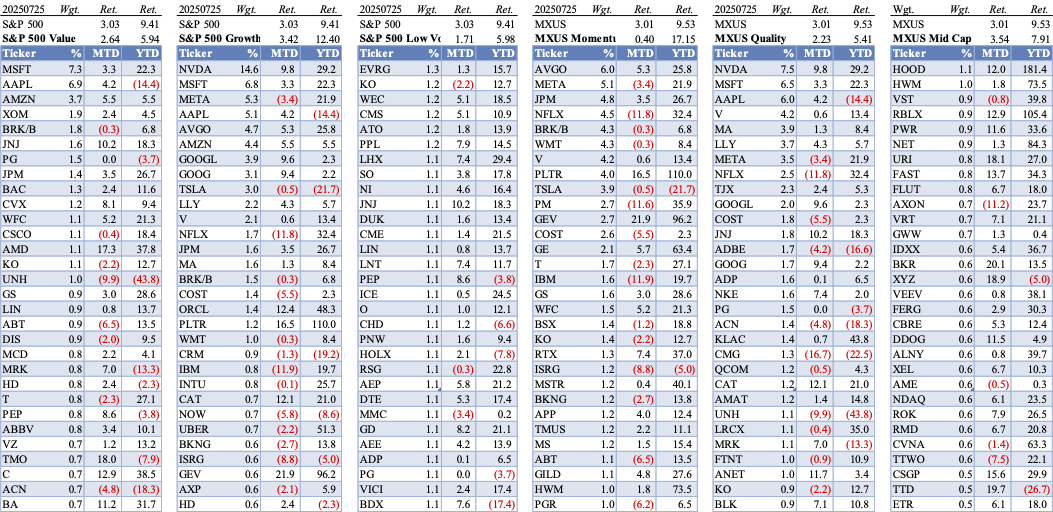
MAFE
Emerging Markets Countries by Sectors Performance Review 新兴市场国家板块表现回顾
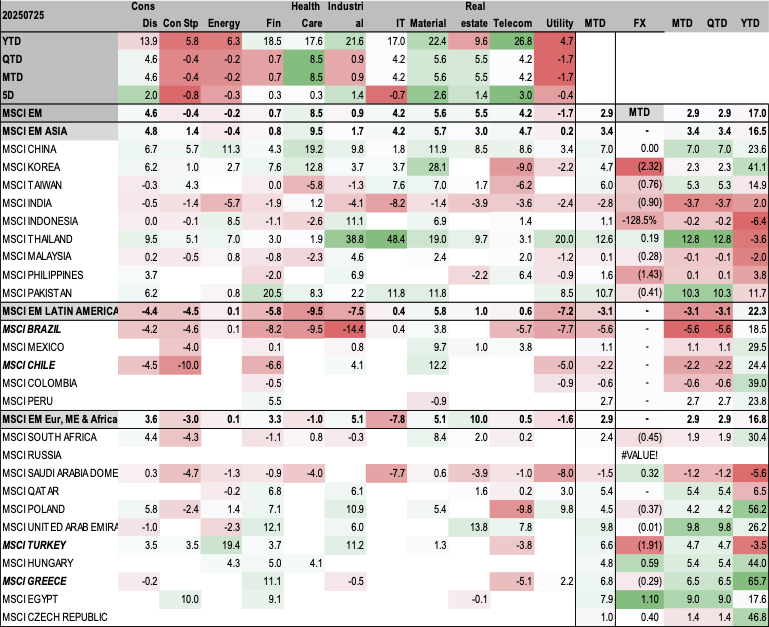
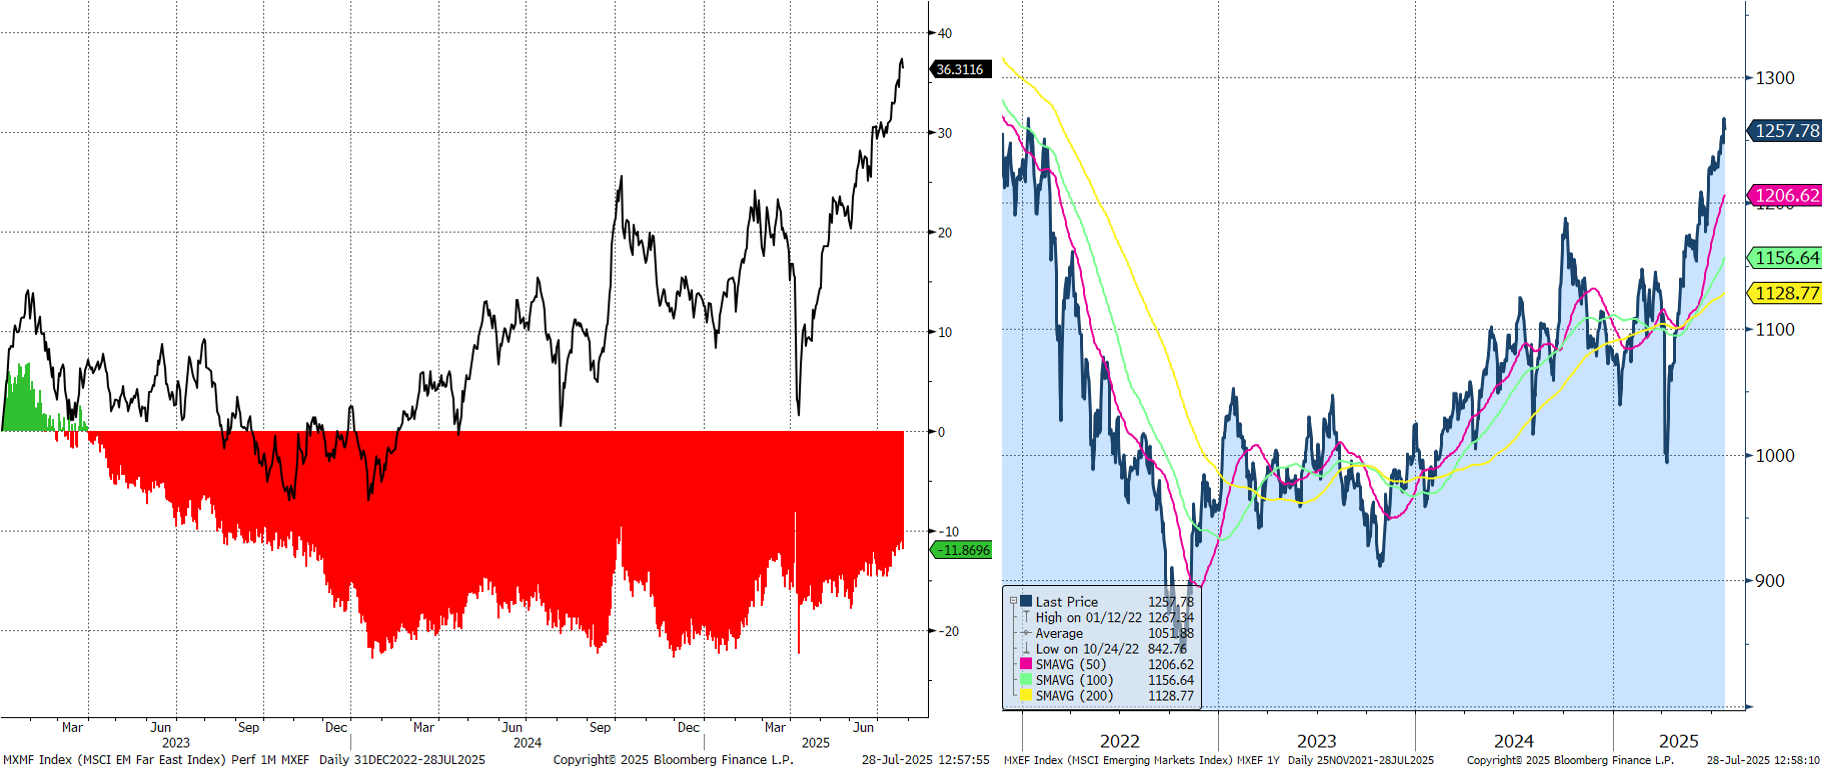
Emerging Market Equity Performance Review 新兴市场股票表现回顾
Fundamentals 基本面
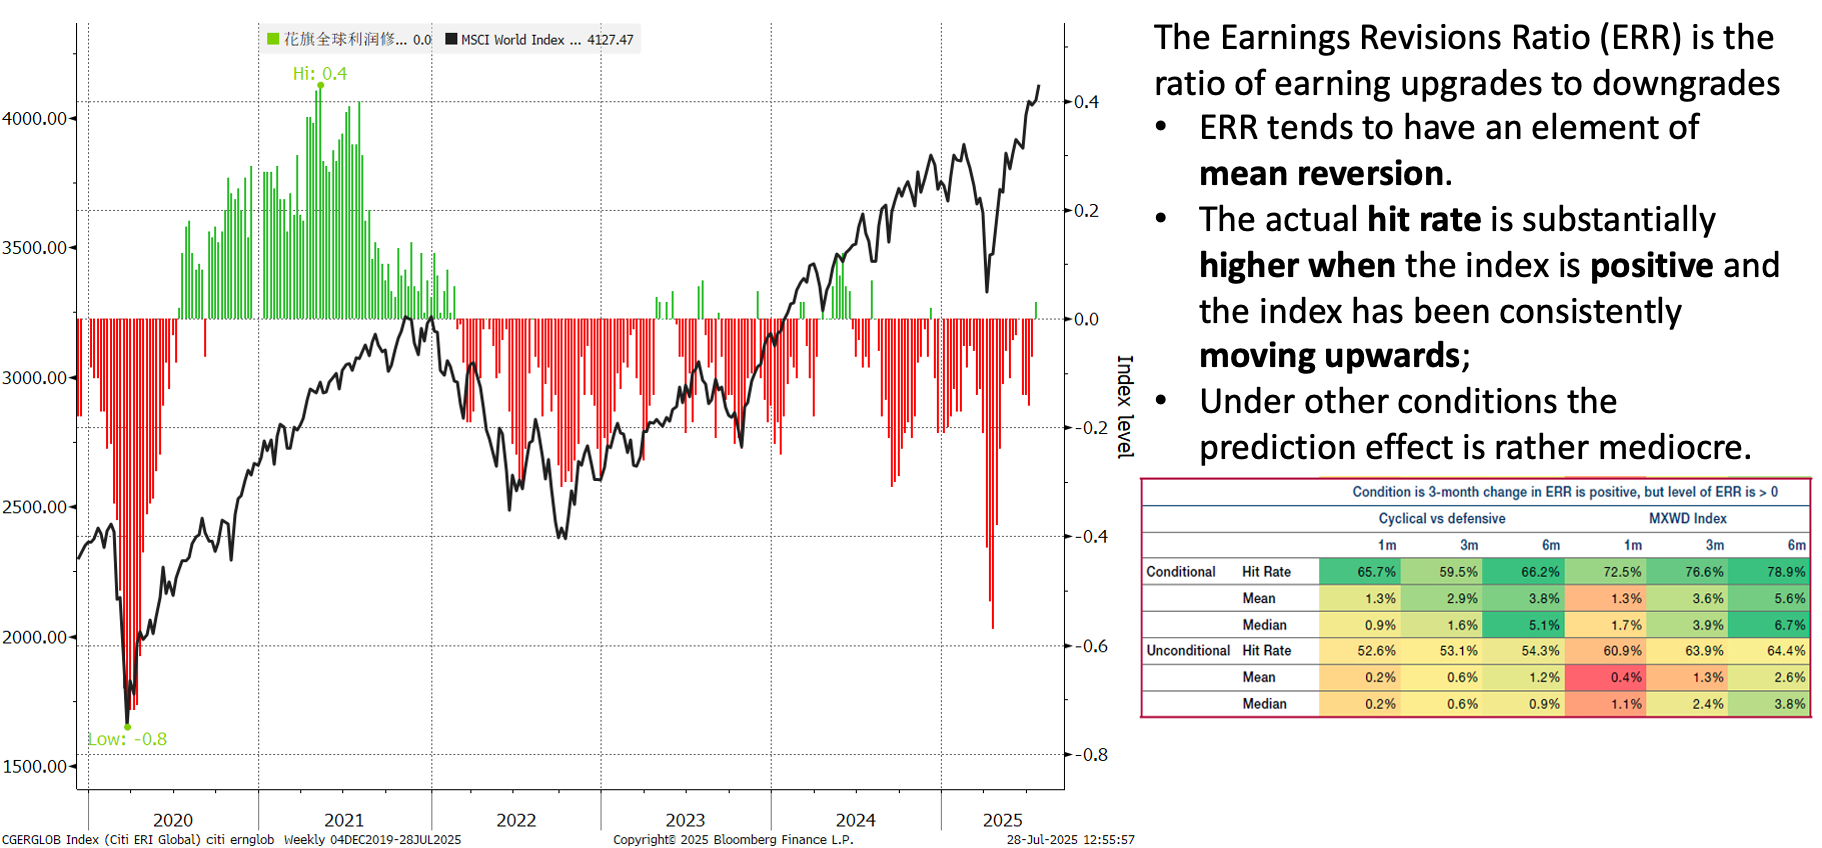
Global Earning Revision Ratio (ERR) 全球盈利修正比率
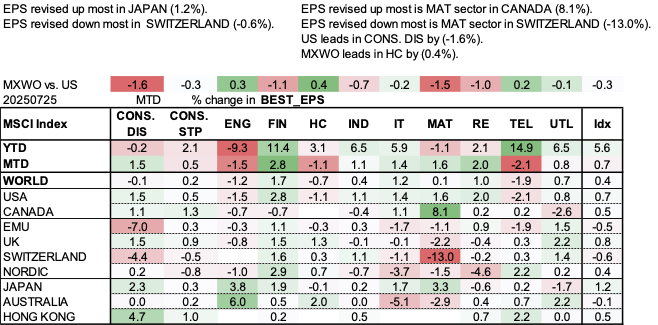
Earnings Revision of Major Markets by Sector 主要市场盈利修正(按板块)
FactSet Updates FactSet 更新
Earnings Consensus Comparison 盈利共识对比
Updated for this month 本月更新数据
- For the second quarter, S&P 500 companies are reporting year-over-year growth in earnings of 6.4% and year-over-year growth in revenues of 5.0%.第二季度,S&P 500 公司报告盈利同比增长6.4%,营收同比增长5.0%。
- For Q3 2025, analysts are projecting earnings growth of 7.6% and revenue growth of 5.1%.对于2025年第三季度,分析师预计盈利增长7.6%,营收增长5.1%。
- For Q4 2025, analysts are projecting earnings growth of 7.0% and revenue growth of 5.6%.对于2025年第四季度,分析师预计盈利增长7.0%,营收增长5.6%。
- For CY 2025, analysts are projecting earnings growth of 9.6% and revenue growth of 5.3%.对于2025财年,分析师预计盈利增长9.6%,营收增长5.3%。
- For CY 2026, analysts are projecting earnings growth of 13.9% and revenue growth of 6.3%.对于2026财年,分析师预计盈利增长13.9%,营收增长6.3%。
As of last month 上月数据
- For the second quarter, S&P 500 companies are expected to report year-over-year growth in earnings of 5.0% and year-over-year growth in revenues of 4.2%.第二季度,S&P 500 公司预计盈利同比增长5.0%,营收同比增长4.2%。
- For Q3 2025, analysts are projecting earnings growth of 7.3% and revenue growth of 4.7%.对于2025年第三季度,分析师预计盈利增长7.3%,营收增长4.7%。
- For Q4 2025, analysts are projecting earnings growth of 6.4% and revenue growth of 5.2%.对于2025年第四季度,分析师预计盈利增长6.4%,营收增长5.2%。
- For CY 2025, analysts are projecting earnings growth of 9.1% and revenue growth of 4.9%.对于2025财年,分析师预计盈利增长9.1%,营收增长4.9%。
- For CY 2026, analysts are projecting earnings growth of 13.8% and revenue growth of 6.3%.对于2026财年,分析师预计盈利增长13.8%,营收增长6.3%。
S&P 500 Earnings Growth Consensus Comparison 标普500盈利增长共识对比
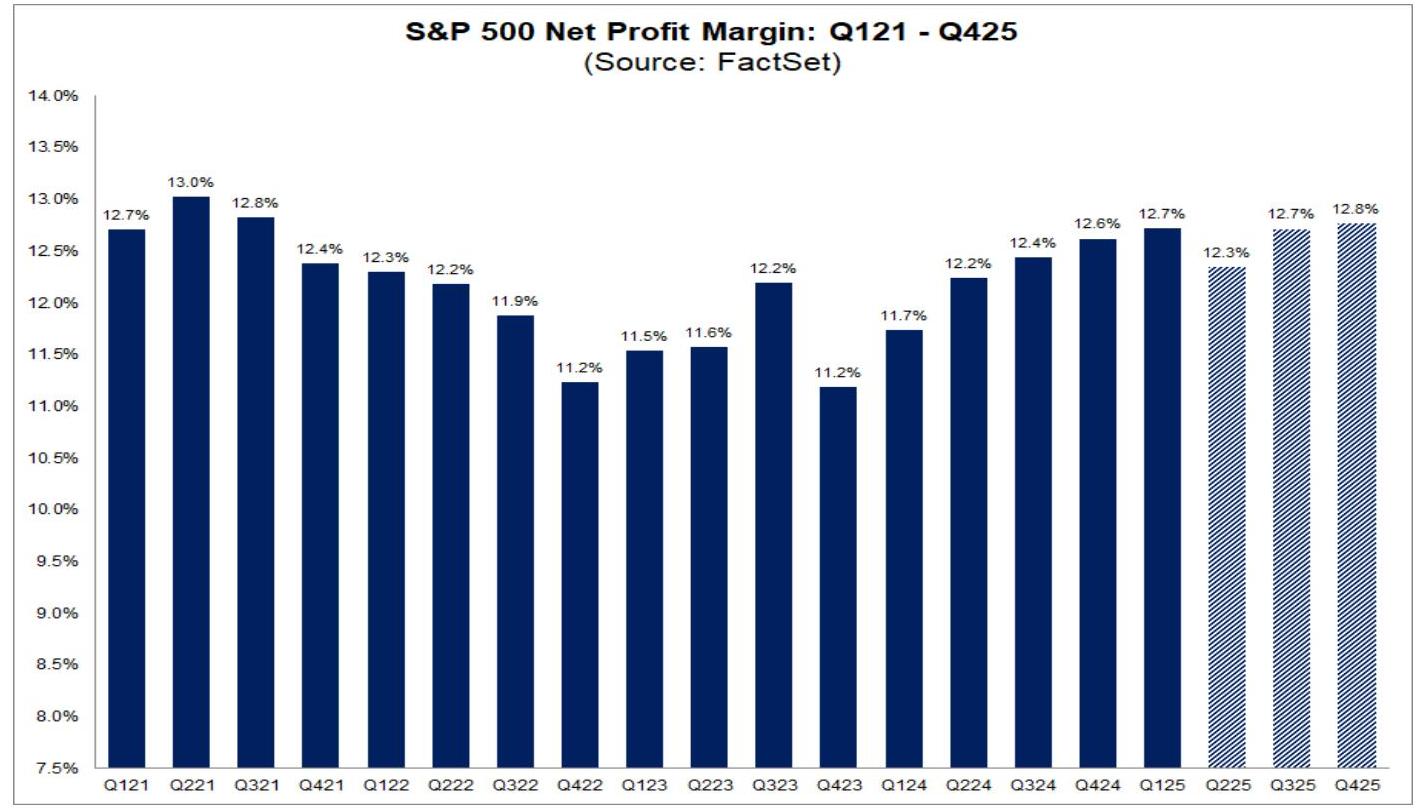
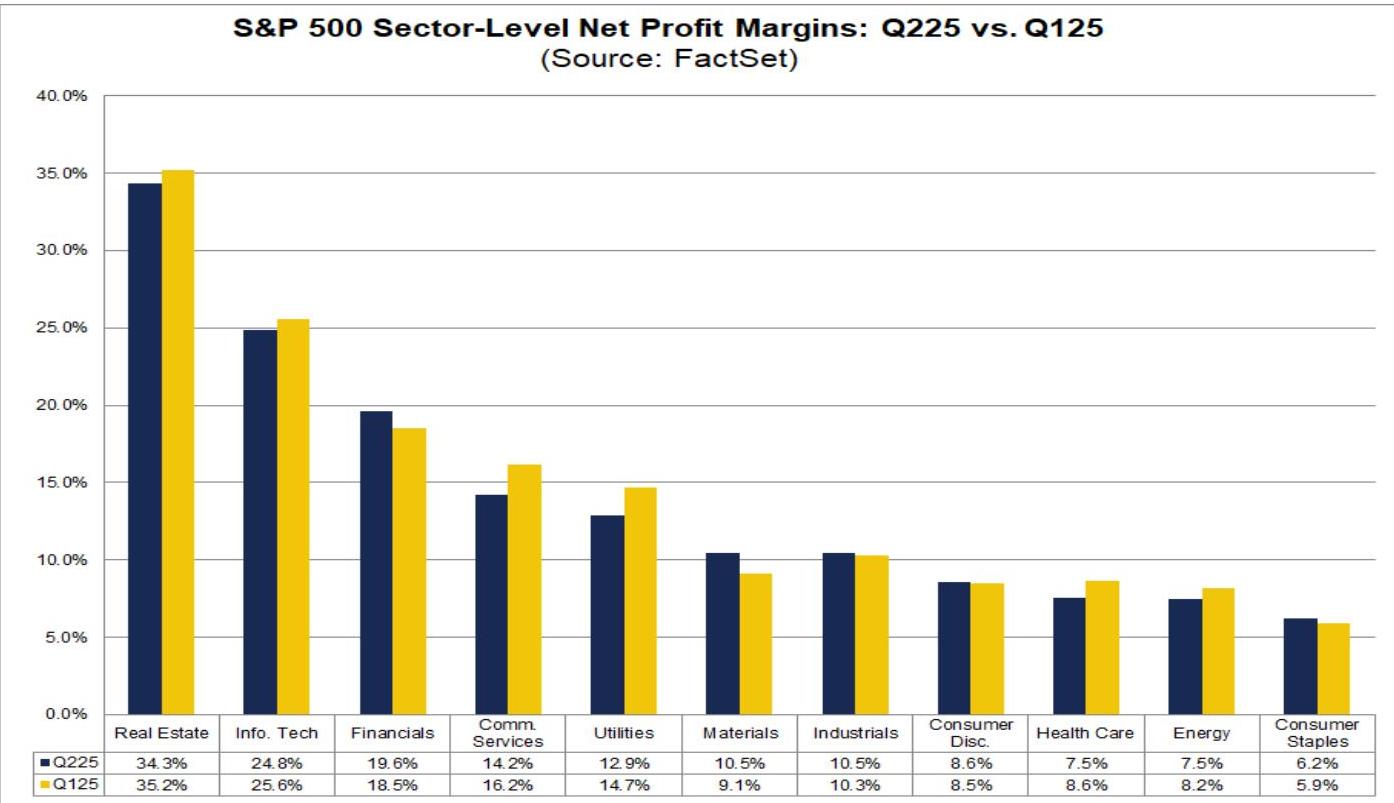
S&P 500: Net Profit Margin Sustained Above 12% for 5 Consecutive Quarters 标普500:净利润率连续5个季度高于12%
Despite market concerns over tariffs and rising costs, the S&P 500's blended net profit margin for Q2 2025 stood at 12.3%. This is lower than the previous quarter (12.7%) but higher than the same period last year (12.2%) and the 5-year average (11.8%). This marks the 5th consecutive quarter where the S&P 500's net profit margin has exceeded 12%, a streak last seen from Q2 2021 to Q2 2022. However, it also represents the first sequential decline in net profit margin since Q4 2023. 尽管市场担忧关税和成本上升,S&P 500在Q2 2025的混合净利润率为12.3%。这低于上一季度(12.7%),但高于去年同期(12.2%)和5年平均值(11.8%)。这是S&P 500连续第5个季度净利润率高于12%,上一次出现这种情况是在Q2 2021至Q2 2022期间。然而,这也标志着自Q4 2023以来首次出现环比净利润率下降。
Industry-level Net Profit Margin Performance: 行业层面净利润率表现:
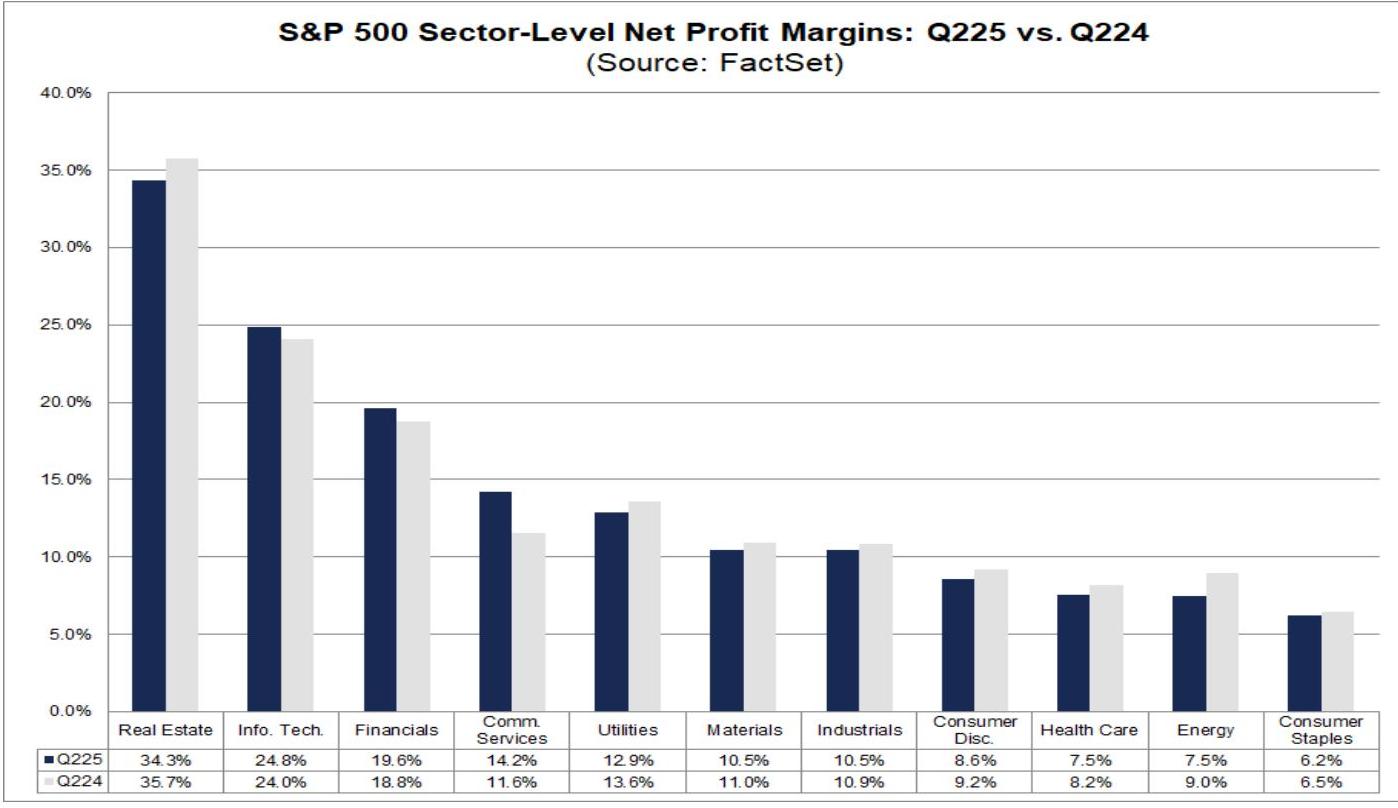
- Year-over-Year Increase:同比提升: 3 industries experienced year-over-year net profit margin growth in Q2 2025: Communication Services (14.2% vs. 11.6%), Information Technology (24.8% vs. 24.0%), and Financials (19.6% vs. 18.8%). 3个行业在Q2 2025实现同比净利润率增长:Communication Services(14.2% vs. 11.6%)、Information Technology(24.8% vs. 24.0%)和Financials(19.6% vs. 18.8%)。
- Year-over-Year Decrease:同比下降: 8 industries saw a year-over-year decrease in net profit margin in Q2 2025, with Energy (7.5% vs. 9.0%) and Real Estate (34.3% vs. 35.7%) leading the decline. 8个行业在Q2 2025出现同比净利润率下降,其中Energy(7.5% vs. 9.0%)和Real Estate(34.3% vs. 35.7%)部门领跌。
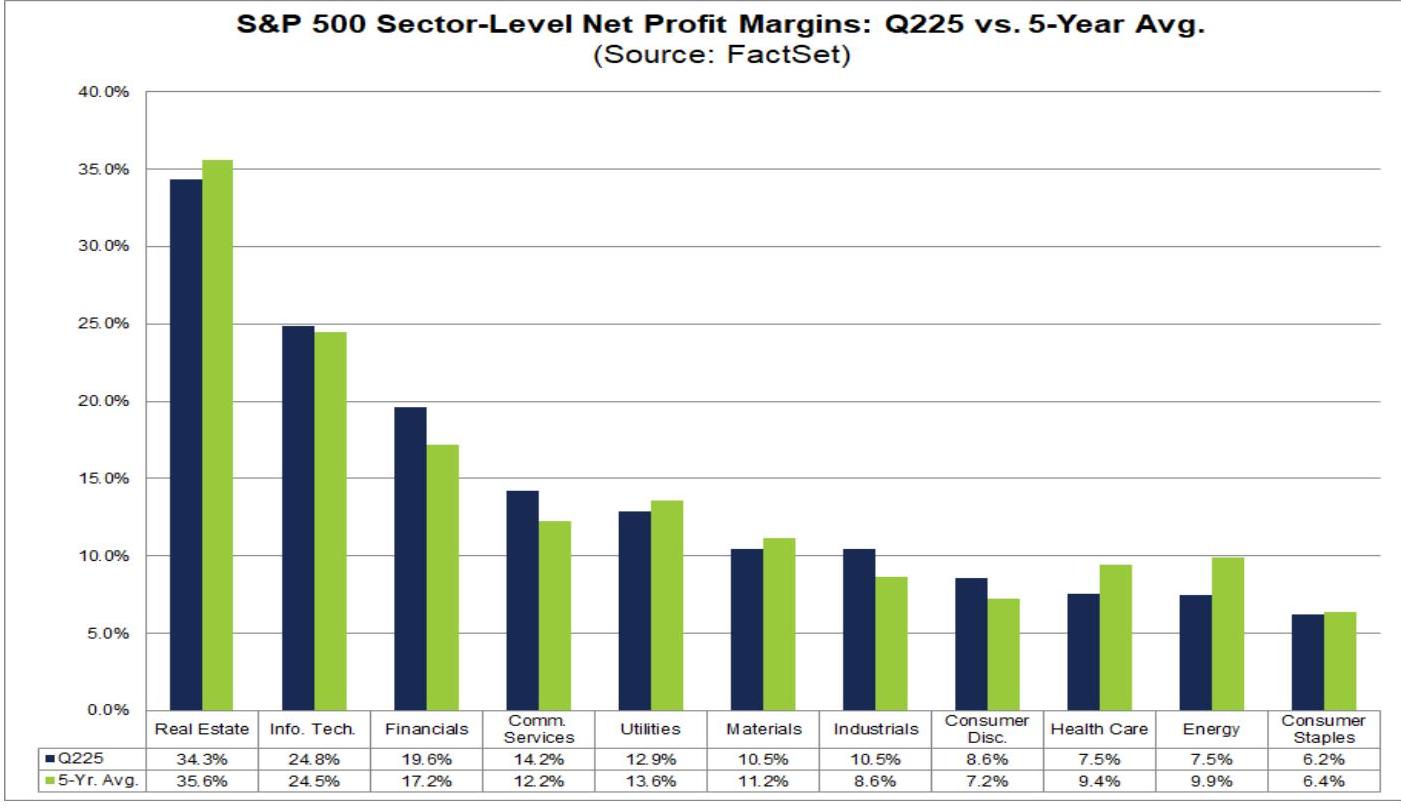
- Above 5-Year Average:高于5年平均水平: 5 industries had net profit margins above their 5-year average in Q2 2025, led by Financials (19.6% vs. 17.2%). 5个行业在Q2 2025的净利润率高于其5年平均水平,以Financials(19.6% vs. 17.2%)为首。
- Below 5-Year Average:低于5年平均水平: 6 industries had net profit margins below their 5-year average in Q2 2025, led by Energy (7.5% vs. 9.9%). 6个行业在Q2 2025的净利润率低于其5年平均水平,以Energy(7.5% vs. 9.9%)为首。
- Sequential Increase:环比提升: 5 industries saw sequential net profit margin growth in Q2 2025, led by Materials (10.5% vs. 9.1%). 5个行业在Q2 2025实现环比净利润率增长,以Materials(10.5% vs. 9.1%)为首。
- Sequential Decrease:环比下降: 6 industries saw a sequential decrease in net profit margin in Q2 2025, led by Communication Services (14.2% vs. 16.2%). 6个行业在Q2 2025出现环比净利润率下降,以Communication Services(14.2% vs. 16.2%)为首。
Analysts expect S&P 500 net profit margins to improve in H2 2025, with projected net profit margins of 12.7% and 12.8% for Q3 2025 and Q4 2025, respectively. 分析师预计S&P 500净利润率将在2025年下半年改善,Q3 2025和Q4 2025的预计净利润率分别为12.7%和12.8%。
S&P 500 Net Profit Margin: Q1 2021 - Q4 2025 标普500净利润率:2021年第一季度 - 2025年第四季度
S&P 500 Sector Net Profit Margin: Q2 2025 vs. Q2 2024 标普500部门净利润率:2025年第二季度 vs. 2024年第二季度
S&P 500 Sector Net Profit Margin: Q2 2025 vs. 5-Year Average 标普500部门净利润率:2025年第二季度 vs. 5年平均
S&P 500 Sector Net Profit Margin: Q2 2025 vs. Q1 2025 标普500部门净利润率:2025年第二季度 vs. 2025年第一季度
S&P 500 Energy and Utilities Sector Earnings Outlook: Q2 2025 标普500能源和公用事业部门盈利展望:2025年第二季度
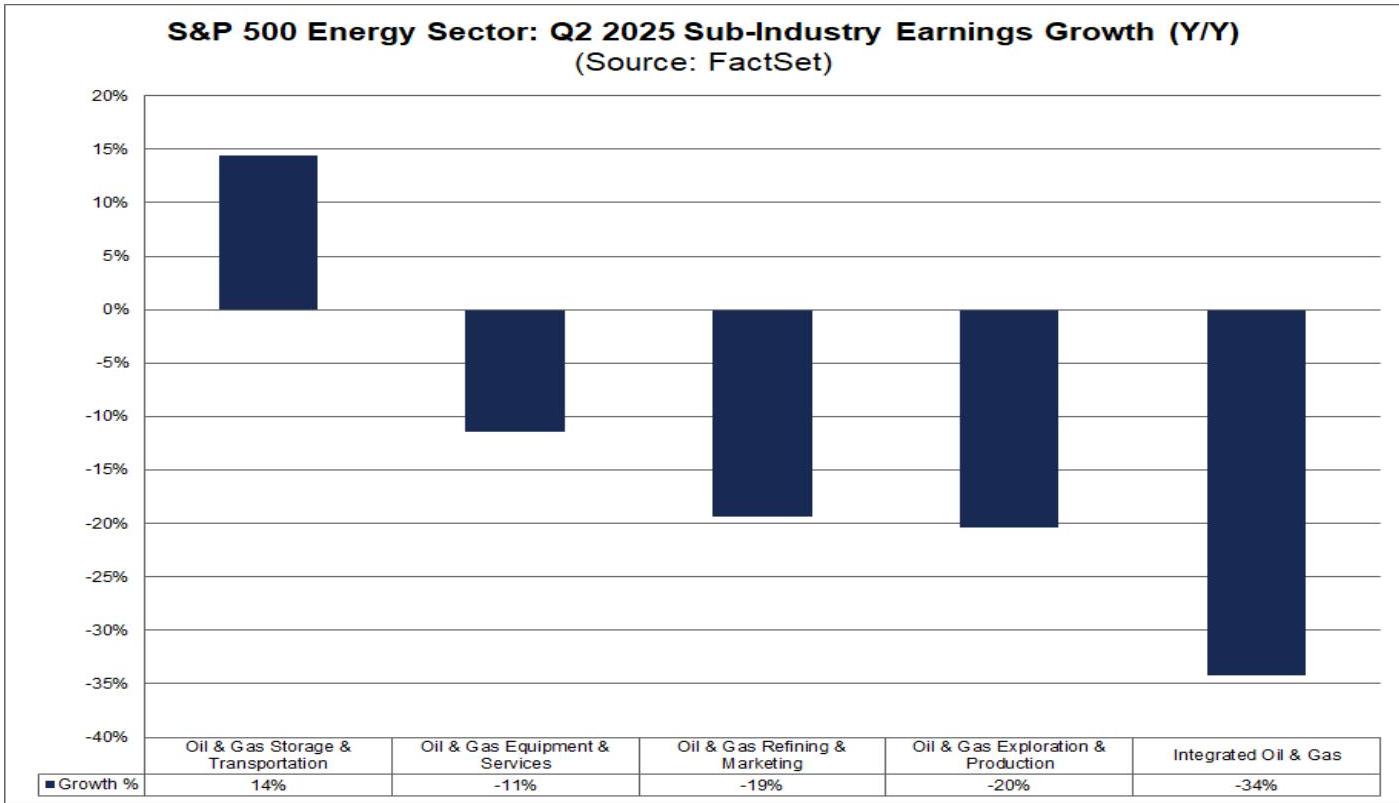
Energy Sector: Largest YoY Earnings Decrease Among All 11 S&P 500 Sectors 能源部门:标普500所有11个部门中盈利同比降幅最大
The Energy sector recorded the largest year-over-year earnings decrease in Q2 2025, at -24.0%. This was primarily due to the average oil price in Q2 2025 ($63.68) being 21% lower than in Q2 2024 ($80.66). Among its 5 sub-industries, 4 are expected to report year-over-year earnings declines, all in double digits: Integrated Oil & Gas (-34%), Oil & Gas Exploration & Production (-20%), Oil & Gas Refining & Marketing (-19%), and Oil & Gas Equipment & Services (-11%). The only sub-industry to show year-over-year growth is Oil & Gas Storage & Transportation (14%). Energy部门在Q2 2025的盈利同比降幅最大,为-24.0%。主要由于2025年第二季度平均油价($63.68)比Q2 2024($80.66)低了21%。其5个子行业中有4个预计盈利同比下降,且均为两位数降幅:Integrated Oil & Gas (-34%)、Oil & Gas Exploration & Production (-20%)、Oil & Gas Refining & Marketing (-19%)和Oil & Gas Equipment & Services (-11%)。唯一实现同比增长的子行业是Oil & Gas Storage & Transportation (14%)。
Energy Sector Sub-industry Earnings Growth (YoY): Q2 2025 能源部门子行业盈利增长(同比):2025年第二季度
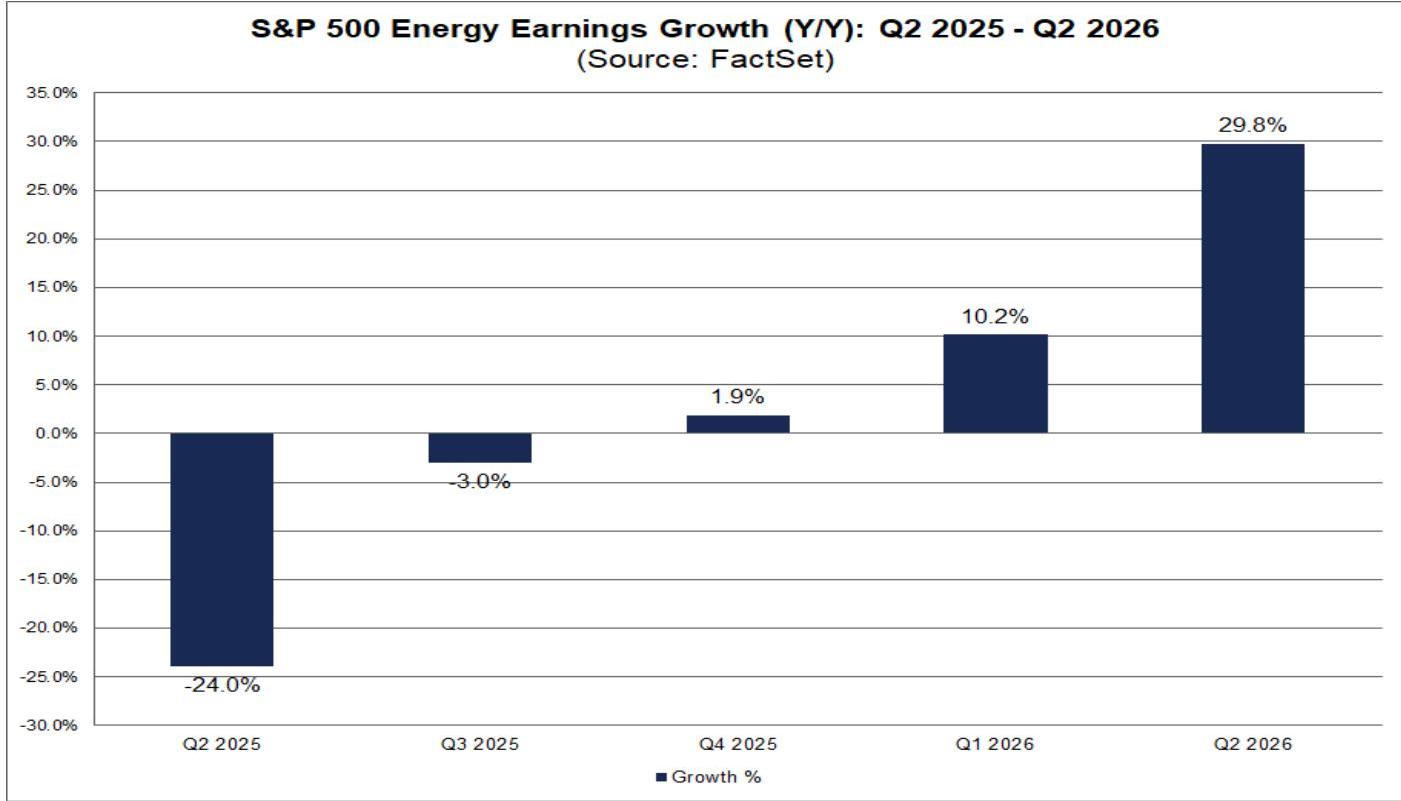
Analysts expect the sector's earnings growth to recover starting from Q4 2025. Q3 2025 is projected to see an earnings decrease of -3.0%, while Q4 2025 to Q2 2026 are expected to have growth rates of 1.9%, 10.2%, and 29.8%, respectively. FactSet Senior Energy Analyst Connor McLean noted that despite producers reducing activity, output levels remain strong. OPEC's continuous reintroduction of crude oil to the market may lead to deeper surplus concerns in 2026. For natural gas, high inventories are pressuring near-term Henry Hub prices, but LNG demand continues to climb year-over-year. Natural gas demand is expected to expand in 2026, driven by LNG exports and data center expansion. Midstream operators may accelerate infrastructure investments, but time mismatches between production, pipelines, and downstream demand could cause price volatility. 展望:分析师预计该部门盈利增长将从Q4 2025开始恢复。Q3 2025预计盈利下降-3.0%。从Q4 2025到Q2 2026,预计盈利增长率分别为1.9%、10.2%和29.8%。FactSet高级能源分析师Connor McLean评论指出:上半年市场情绪因油价疲软和全球贸易不确定性而保持谨慎。尽管生产商减少了活动,但产量水平仍保持强劲。OPEC持续将原油带回市场,可能导致2026年更深度的过剩担忧。天然气市场:库存高企压制近期Henry Hub价格,但液化天然气(LNG)需求持续同比攀升。随着LNG出口和数据中心扩张推动用电需求,天然气需求预计在2026年扩大。中游运营商可能加速对基础设施的投资,但生产、管道和下游需求之间的时间错配可能导致价格波动。
FactSet Energy Analyst Katrina Abuls commented on LNG project trends, highlighting that several US LNG projects, including Venture Global's CP2, NextDecade's Rio Grande Train 4, Sempra's Port Arthur Phase 2, and Energy Transfer's Lake Charles LNG, are expected to reach Final Investment Decision (FID) by the end of 2025. These projects are advancing with offtake and EPC agreements. Additional facilities could bring upside risk to Henry Hub prices in the next decade, especially without new pipeline infrastructure to the Gulf Coast. Recent market focus is on the timeline for ExxonMobil's Golden Pass LNG facility's first LNG production, which could increase demand and support Henry Hub prices this winter. FactSet能源分析师Katrina Abuls评论LNG项目趋势:关注2025年预计达成最终投资决定(FID)的美国LNG项目。包括Venture Global的CP2、NextDecade的Rio Grande Train 4、Sempra的Port Arthur Phase 2和Energy Transfer的Lake Charles LNG,这些项目都在推进承购和EPC协议,旨在年底前实现FID。这些项目紧随Cheniere的Corpus Christi Trains 8/9和Woodside的Louisiana LNG的积极FID。额外设施可能在未来十年给Henry Hub价格带来上行风险,特别是在缺乏新管道基础设施到Gulf Coast的情况下。近期市场关注ExxonMobil的Golden Pass LNG设施首次LNG产出的时间线,这可能在今年冬天增加需求并支撑Henry Hub价格。
S&P 500 Energy Sector: Q2 2025 - Q2 2026 Earnings Growth (YoY) 标普500能源部门:2025年第二季度 - 2026年第二季度盈利增长(同比)
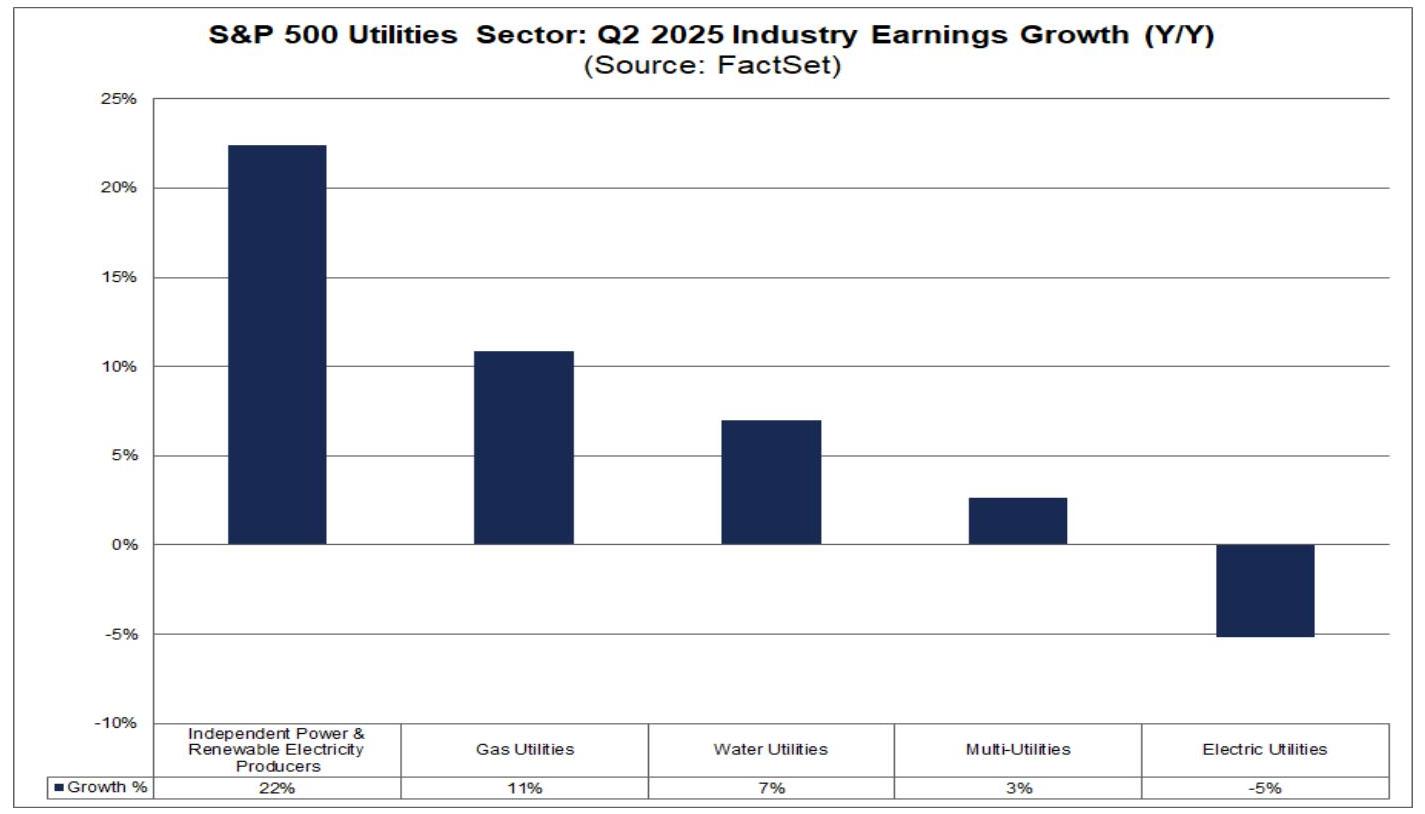
Utilities Sector: 4 of 5 Industries Report YoY Earnings Growth 公用事业部门:5个行业中有4个报告同比盈利增长
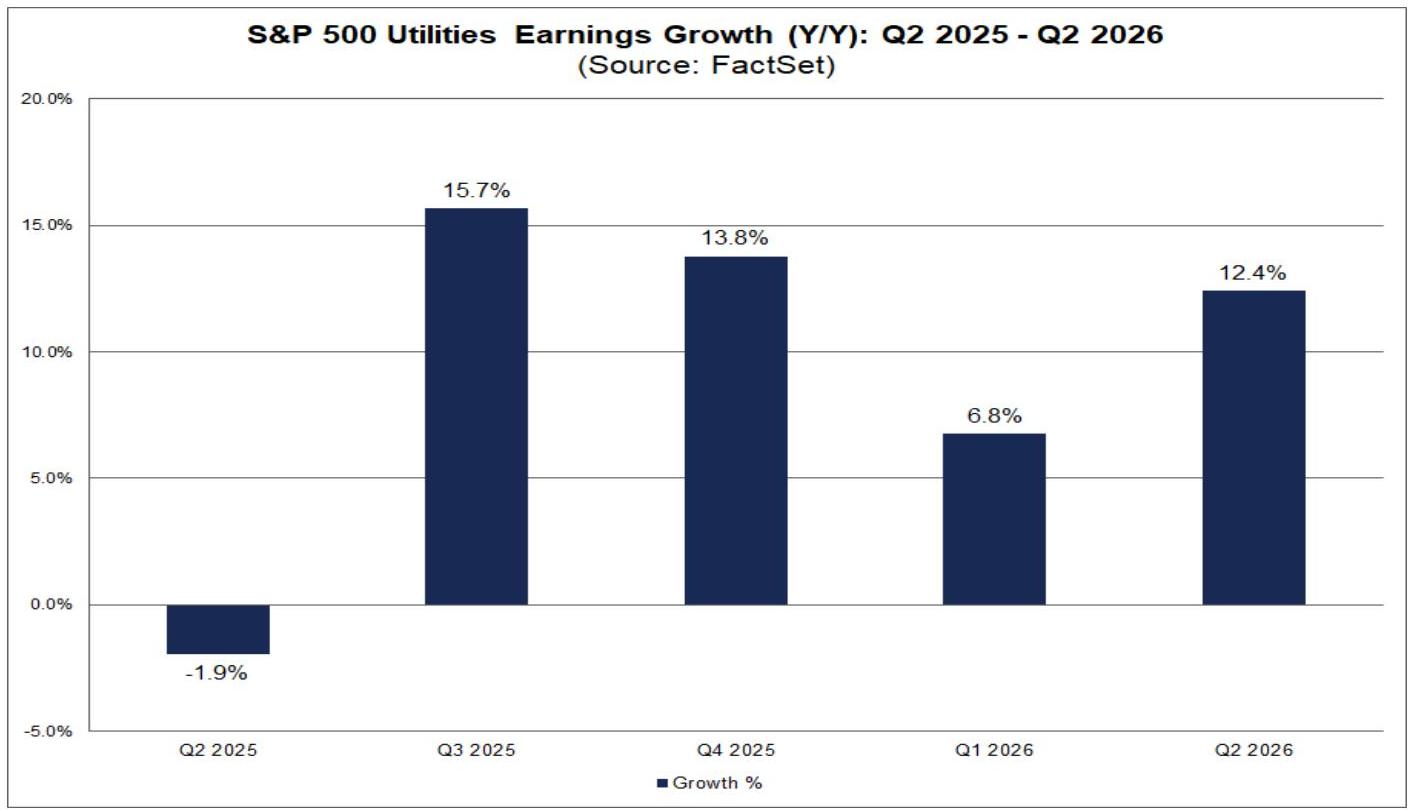
The Utilities sector's earnings decreased by -1.9% in Q2 2025. However, 4 out of 5 industries within the sector reported or are expected to report year-over-year earnings growth: Independent Power and Renewable Energy Producers (22%), Gas Utilities (11%), Water Utilities (7%), and Multi-Utilities (3%). The only industry reporting a year-over-year decline was Electric Utilities (-5%), which was also the biggest drag on the sector's overall earnings growth. Excluding Electric Utilities, the Utilities sector's earnings growth would have been 6.2%. Utilities部门在Q2 2025盈利下降-1.9%。然而,其5个行业中有4个报告或预计报告同比盈利增长:Independent Power and Renewable Energy Producers(22%)、Gas Utilities(11%)、Water Utilities(7%)和Multi-Utilities(3%)。唯一报告同比下降的行业是Electric Utilities(-5%),其也是该部门盈利增长的最大拖累因素。如果排除Electric Utilities,Utilities部门的盈利增长将达到6.2%。
Utilities Sector Industry Earnings Growth (YoY): Q2 2025 公用事业部门行业盈利增长(同比):2025年第二季度
Analysts expect the sector's earnings growth to recover over the next 4 quarters, with projected growth rates of 15.7%, 13.8%, 6.8%, and 12.4% from Q3 2025 to Q2 2026, respectively. FactSet Senior Energy Analyst Trevor Fujita noted that the recently passed "One Big Beautiful Bill Act" significantly shortened the eligibility window for Inflation Reduction Act clean energy tax credits. New solar and wind projects must be operational by the end of 2027 or begin construction before July 4, 2026, much earlier than the original 2032 deadline. FactSet currently tracks 65.5GW of solar and 22.8GW of wind projects in advanced development targeting operation by the end of 2027, but supply chain issues and potential tariffs could prevent many from receiving tax credits. These hurdles, coupled with the growing demand from AI data centers, enhance the outlook for natural gas in power generation. However, continued coal dependence could curb future natural gas demand. For instance, Georgia Power now plans to operate its Scherer and Bowen coal-fired power plants until 2038, instead of the original 2028 and 2035 retirement dates. An estimated 60.5GW of coal-fired power plants are expected to retire by 2030, and any delay in these retirements will limit the growth potential of natural gas consumption in the power sector. 展望:分析师预计该部门盈利增长将在未来4个季度恢复。Q3 2025至Q2 2026,预计盈利增长率分别为15.7%、13.8%、6.8%和12.4%。FactSet高级能源分析师Trevor Fujita评论指出:最近通过的《One Big Beautiful Bill Act》大幅缩短了《Inflation Reduction Act》清洁能源税收抵免的资格窗口。新的太阳能和风能项目必须在2027年底前投入运营或在2026年7月4日前开始建设,这比原定的2032年截止日期提前了很多。FactSet目前追踪到美国有65.5GW太阳能和22.8GW风能项目处于高级开发阶段,目标是在2027年底前投入运营,但供应链问题和可能的关税可能使许多项目无法获得税收抵免。这些障碍,加上AI数据中心不断增长的需求,增强了天然气在发电领域的展望。然而,持续的煤炭依赖可能会抑制未来的天然气需求。例如,Georgia Power现在计划将旗下Scherer和Bowen燃煤电厂运行至2038年,而非原计划的2028年和2035年退役。预计到2030年将有60.5GW燃煤电厂退役,任何退役延迟都将限制天然气在电力部门消费的增长潜力。
S&P 500 Utilities Sector: Q2 2025 - Q2 2026 Earnings Growth (YoY) 标普500公用事业部门:2025年第二季度 - 2026年第二季度盈利增长(同比)
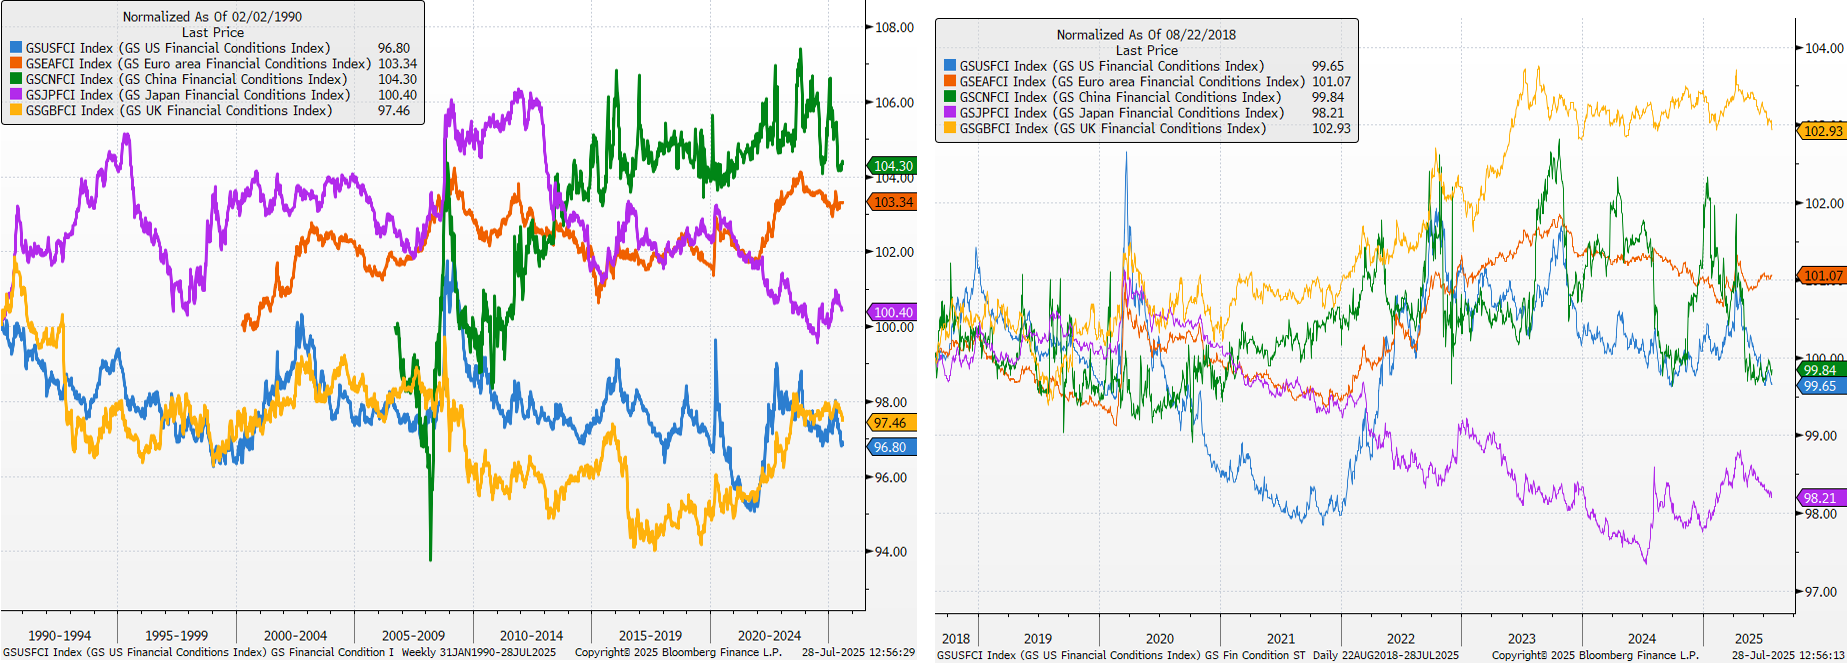
Goldman Sachs Financial Condition Indices 高盛金融状况指数
Valuation 估值
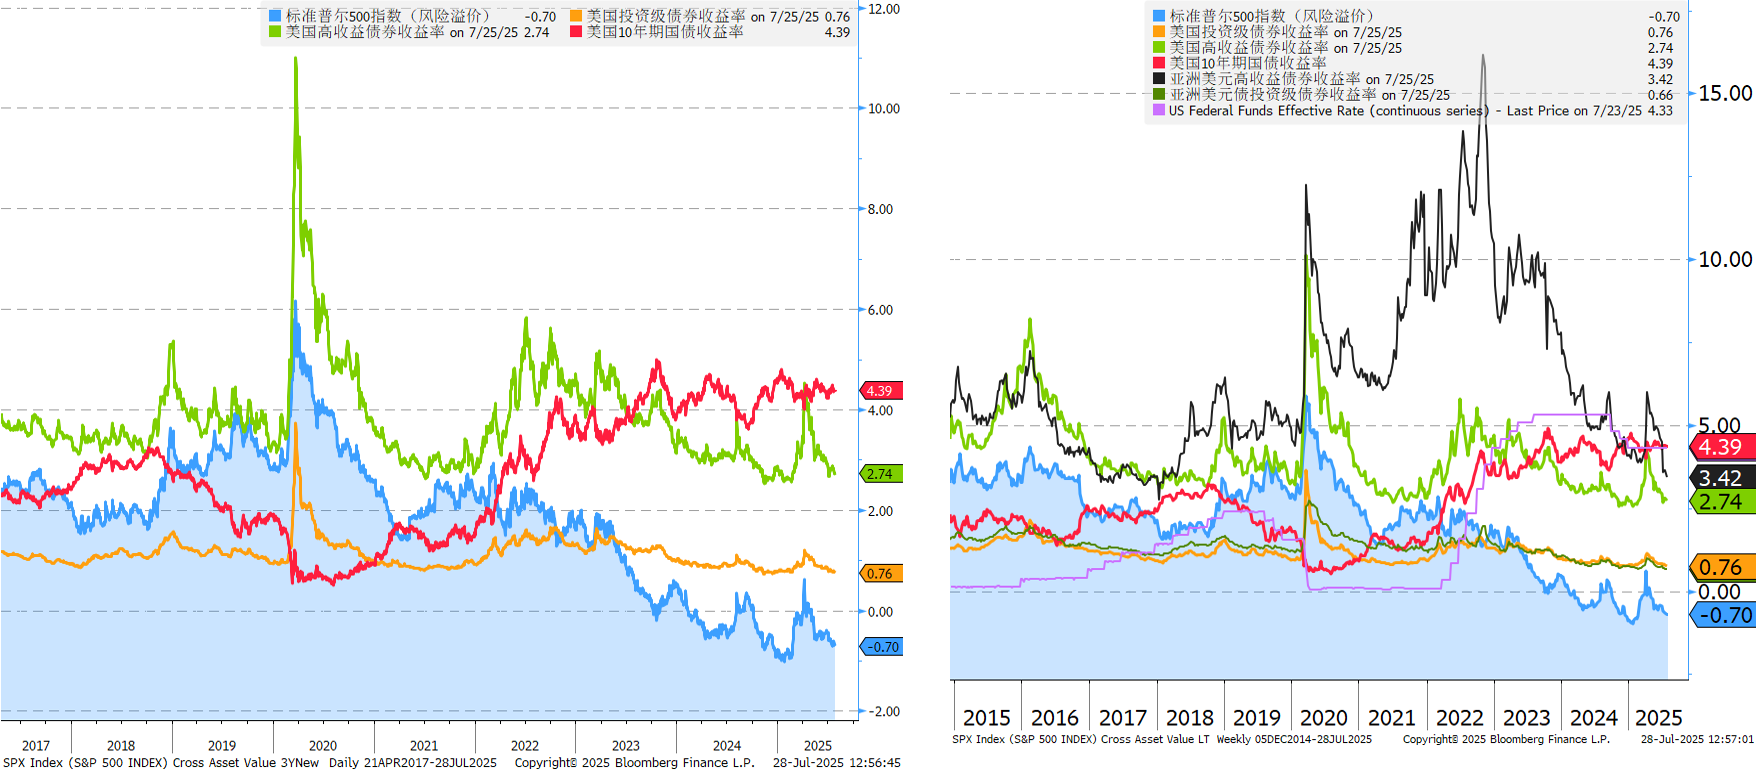
Cross Assets Valuation 跨资产估值
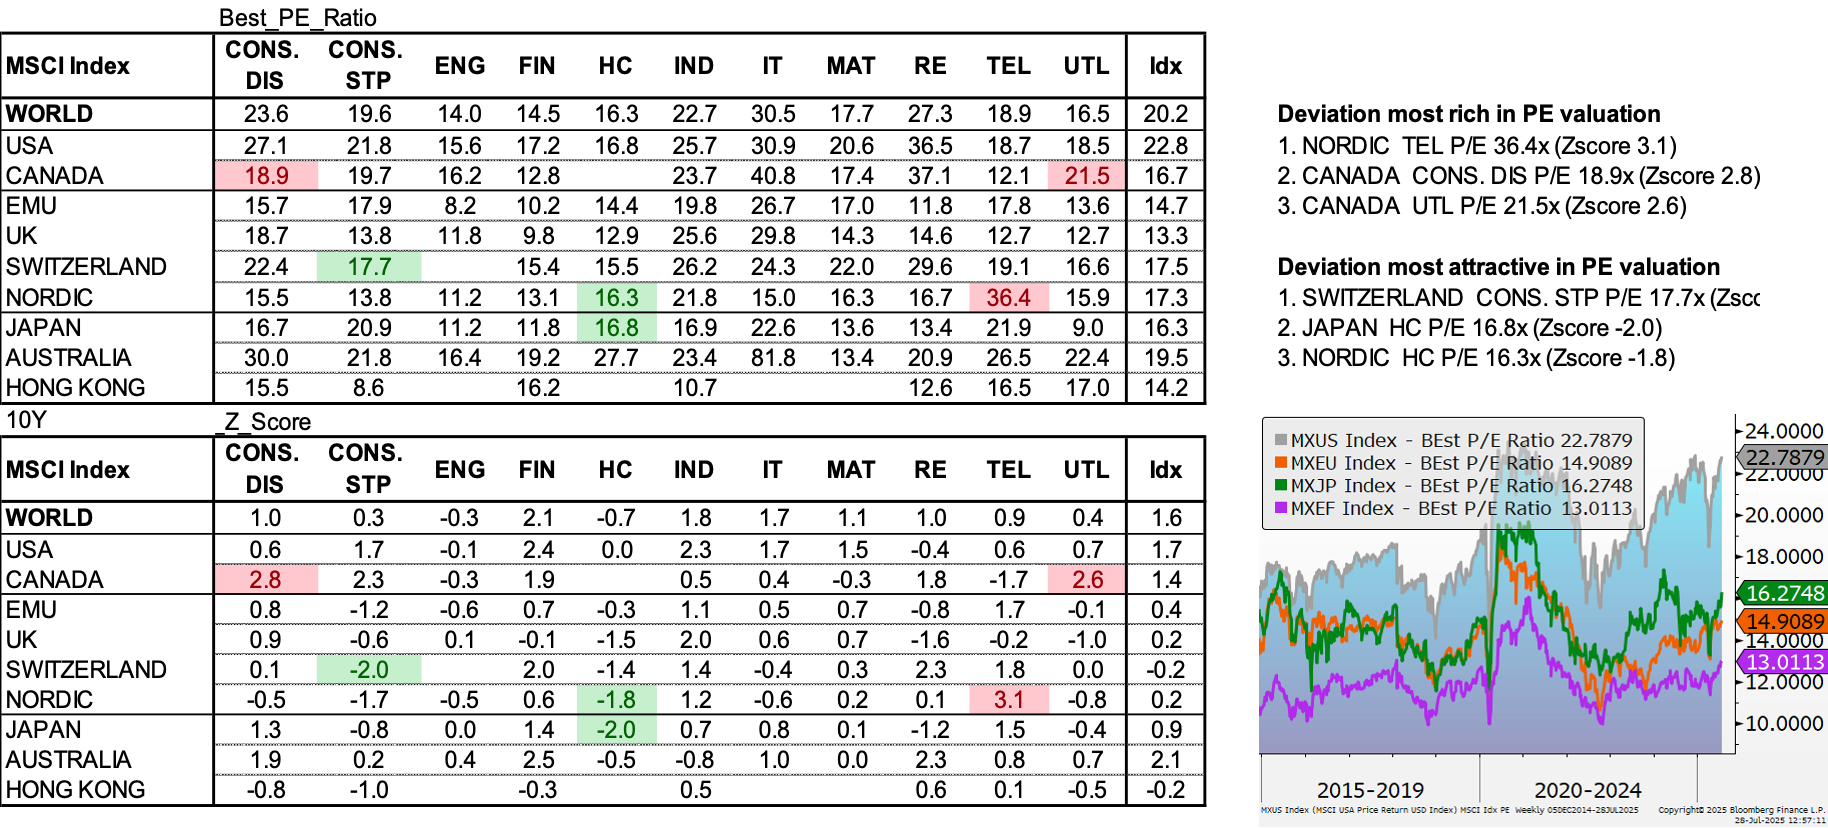
Major Markets’ Forward PE Ratio 主要市场远期市盈率
Major Markets’ Forward PE Ratio Change 主要市场远期市盈率变化
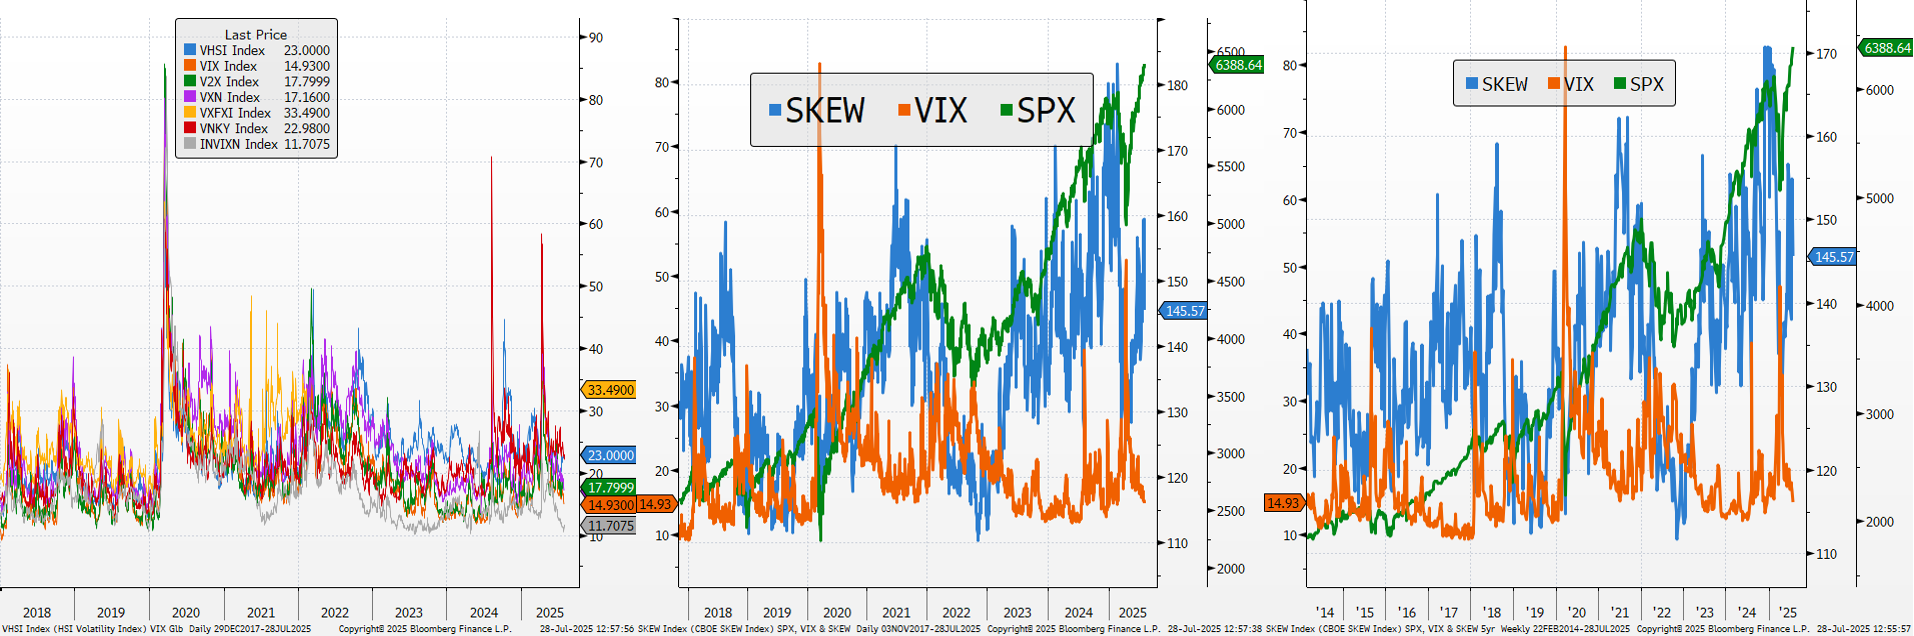
VIX and Skew VIX与偏度
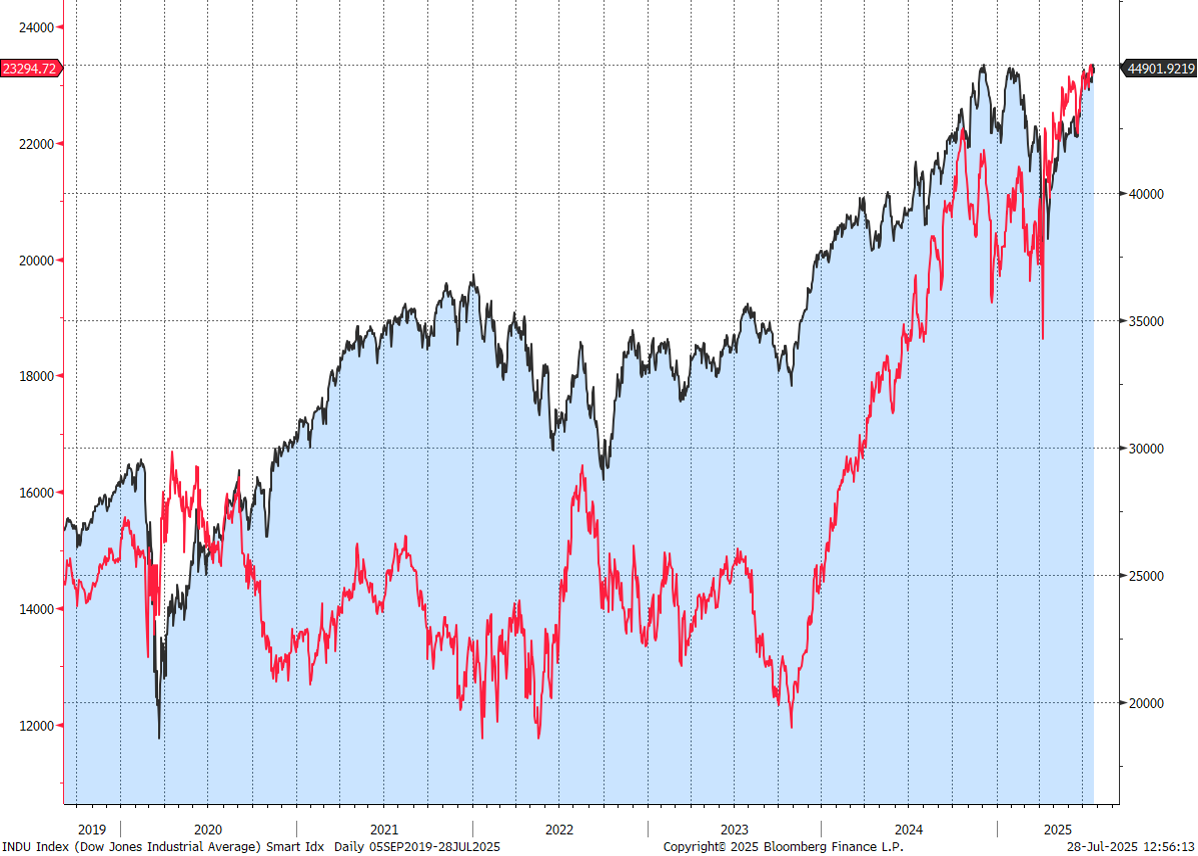
Smart Money Flow Index 智能资金流指数
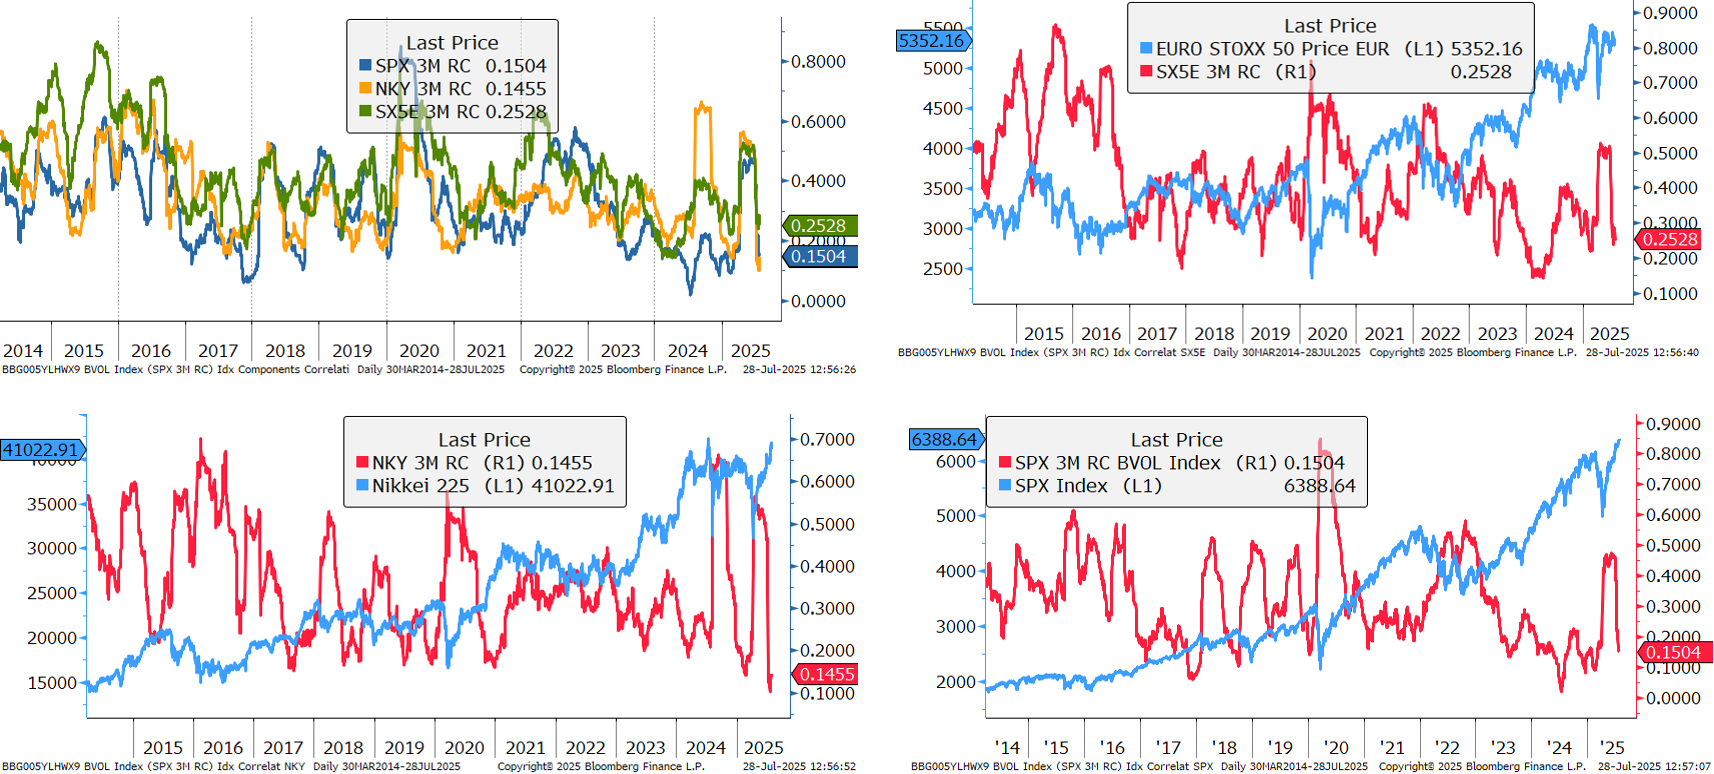
Intra Market Correlation 市场内部相关性
BofA Global Fund Manager Survey 美银全球基金经理调查
Key Logic 核心逻辑
Bank of America's latest Global Fund Manager Survey (FMS) indicates that despite a significant increase in investor risk appetite and profit expectations, with allocations to Technology Stocks and short positions in US Dollar reaching historical highs, market sentiment has peaked. However, the report suggests that investors are more likely to employ hedging and asset rotation strategies rather than a large-scale withdrawal, as equity overweight is not yet extreme and bond market volatility remains low. The report also warns about the consensus positions most vulnerable to pullbacks driven by Bond Market or Earnings Per Share (EPS) drivers, including shorting US Dollar, long US Technology Stocks, and long European Banks. Bank of America的最新Global Fund Manager Survey(FMS)显示,尽管投资者的风险偏好和利润预期显著提升,对Technology Stocks的配置和做空US Dollar的仓位达到历史高点,表明市场情绪达到“见顶”状态,但报告认为,由于股票超配程度尚未极端且债券波动率较低,投资者更可能采取对冲和资产轮动策略,而非大规模撤资。同时,报告警示了当前市场最容易受到Bond Market或Earnings Per Share驱动的回撤所影响的共识头寸,包括做空US Dollar、做多US Technology Stocks和做多European Banks。
Investment Sentiment and Risk Appetite 投资情绪与风险偏好
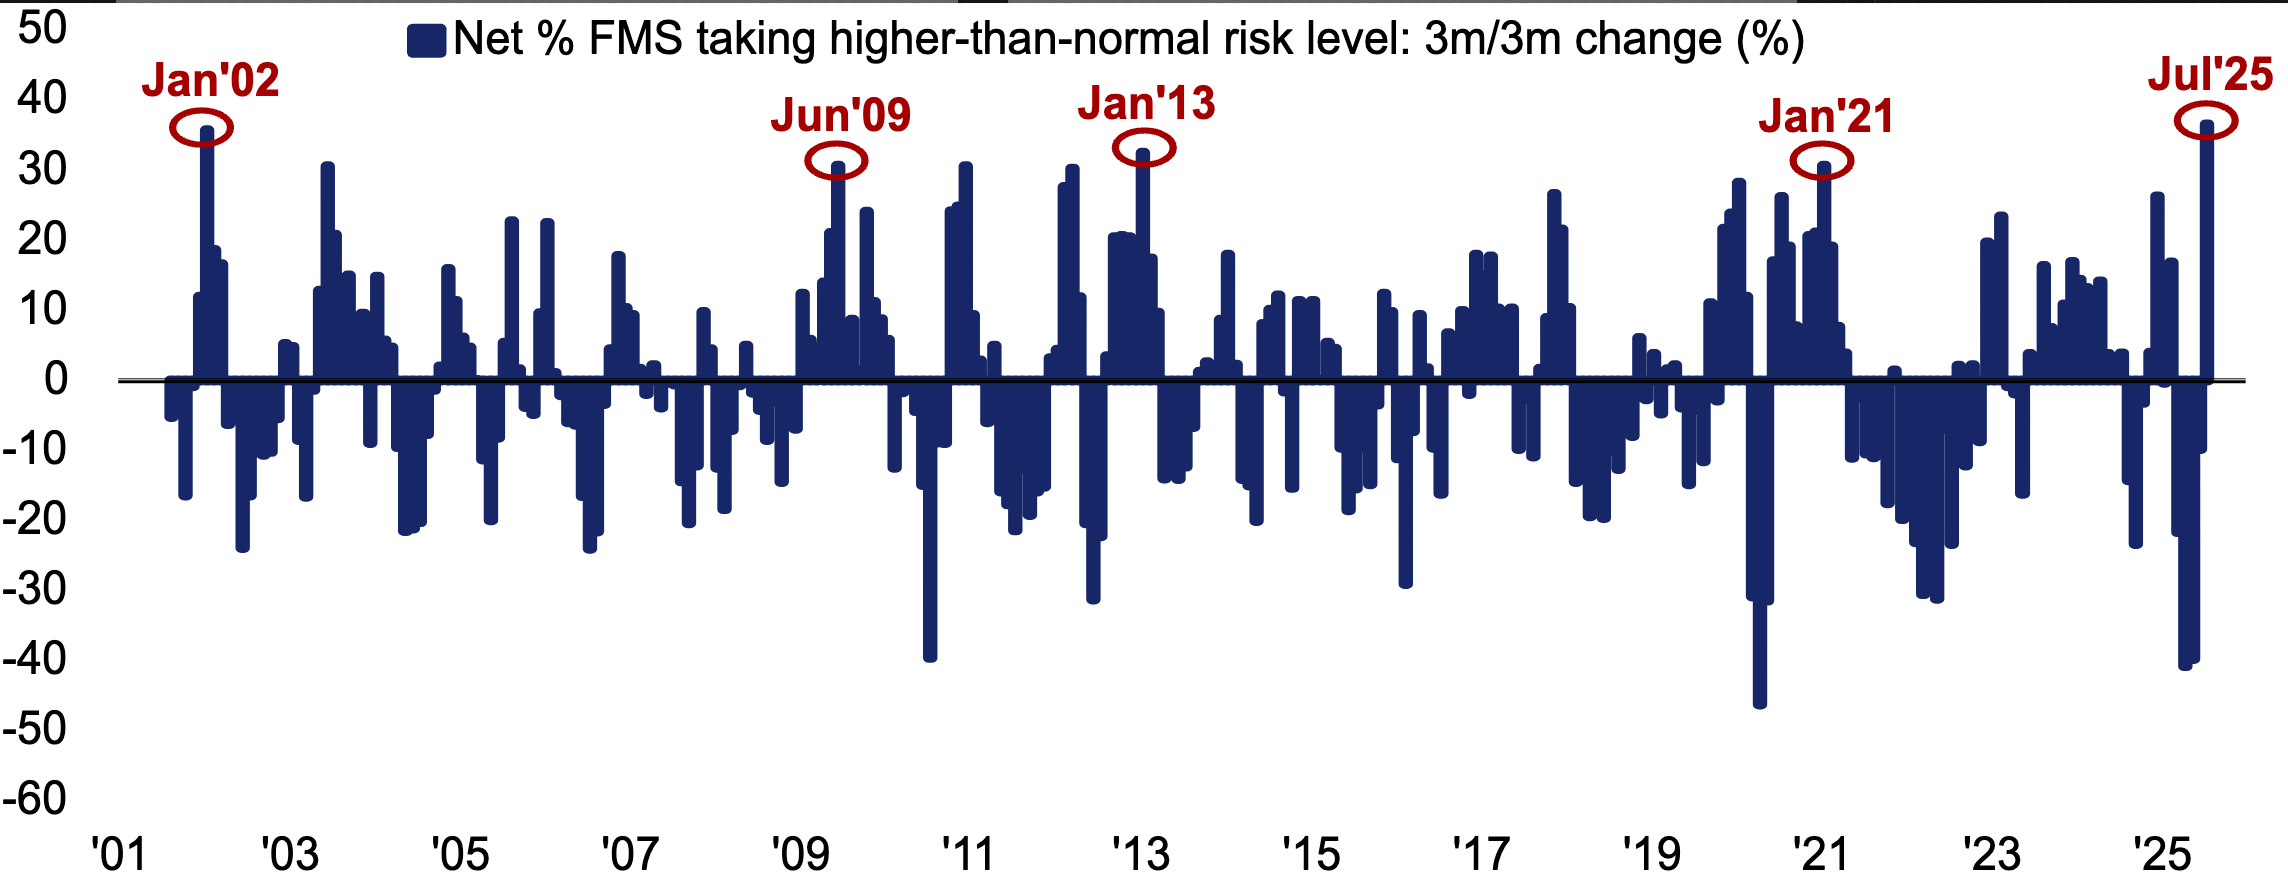
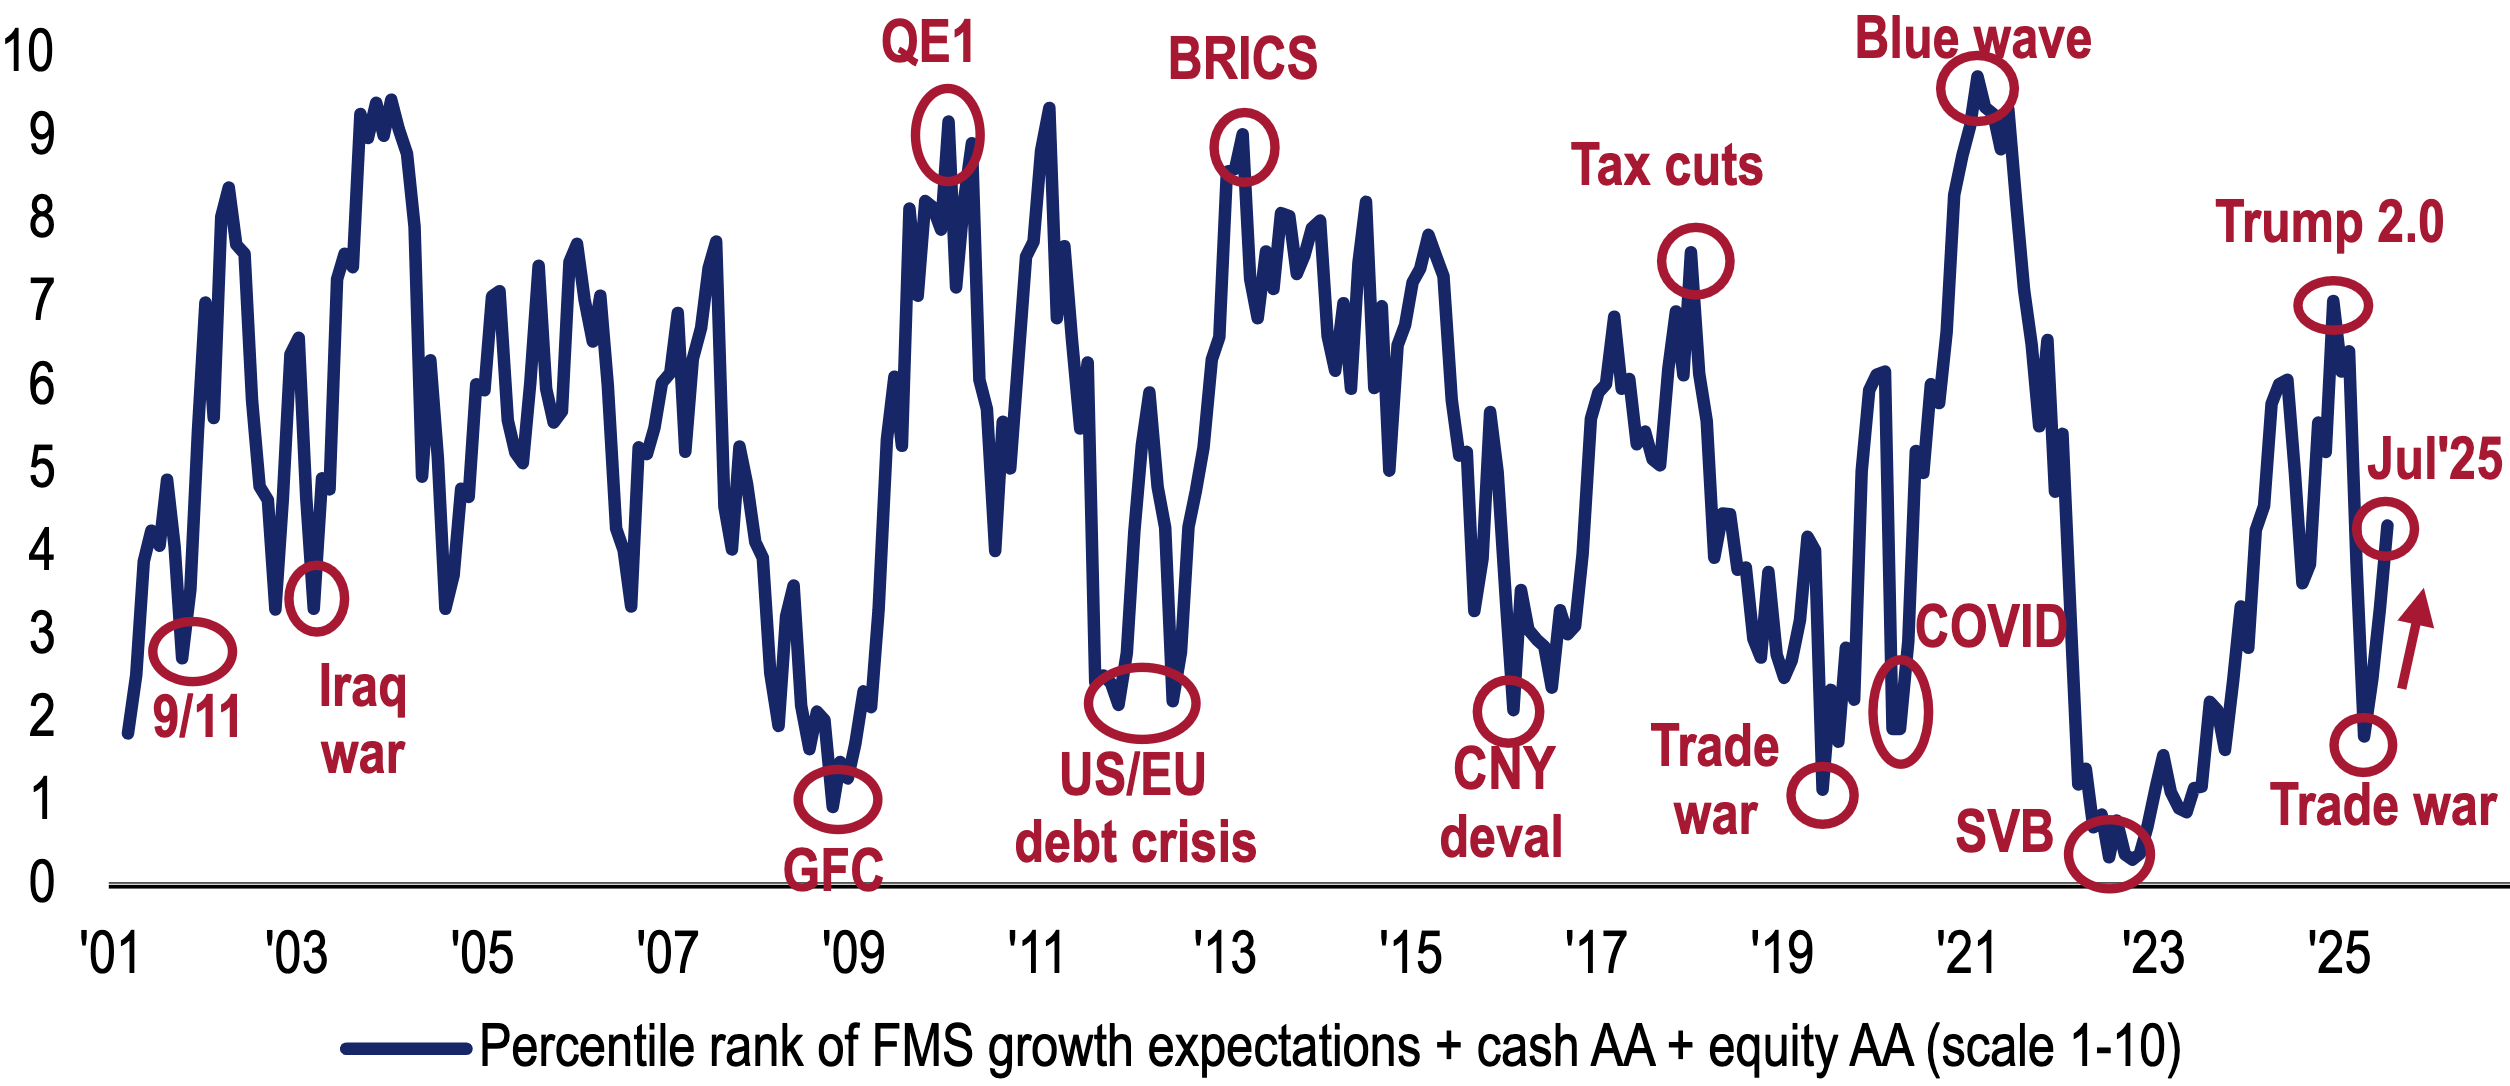
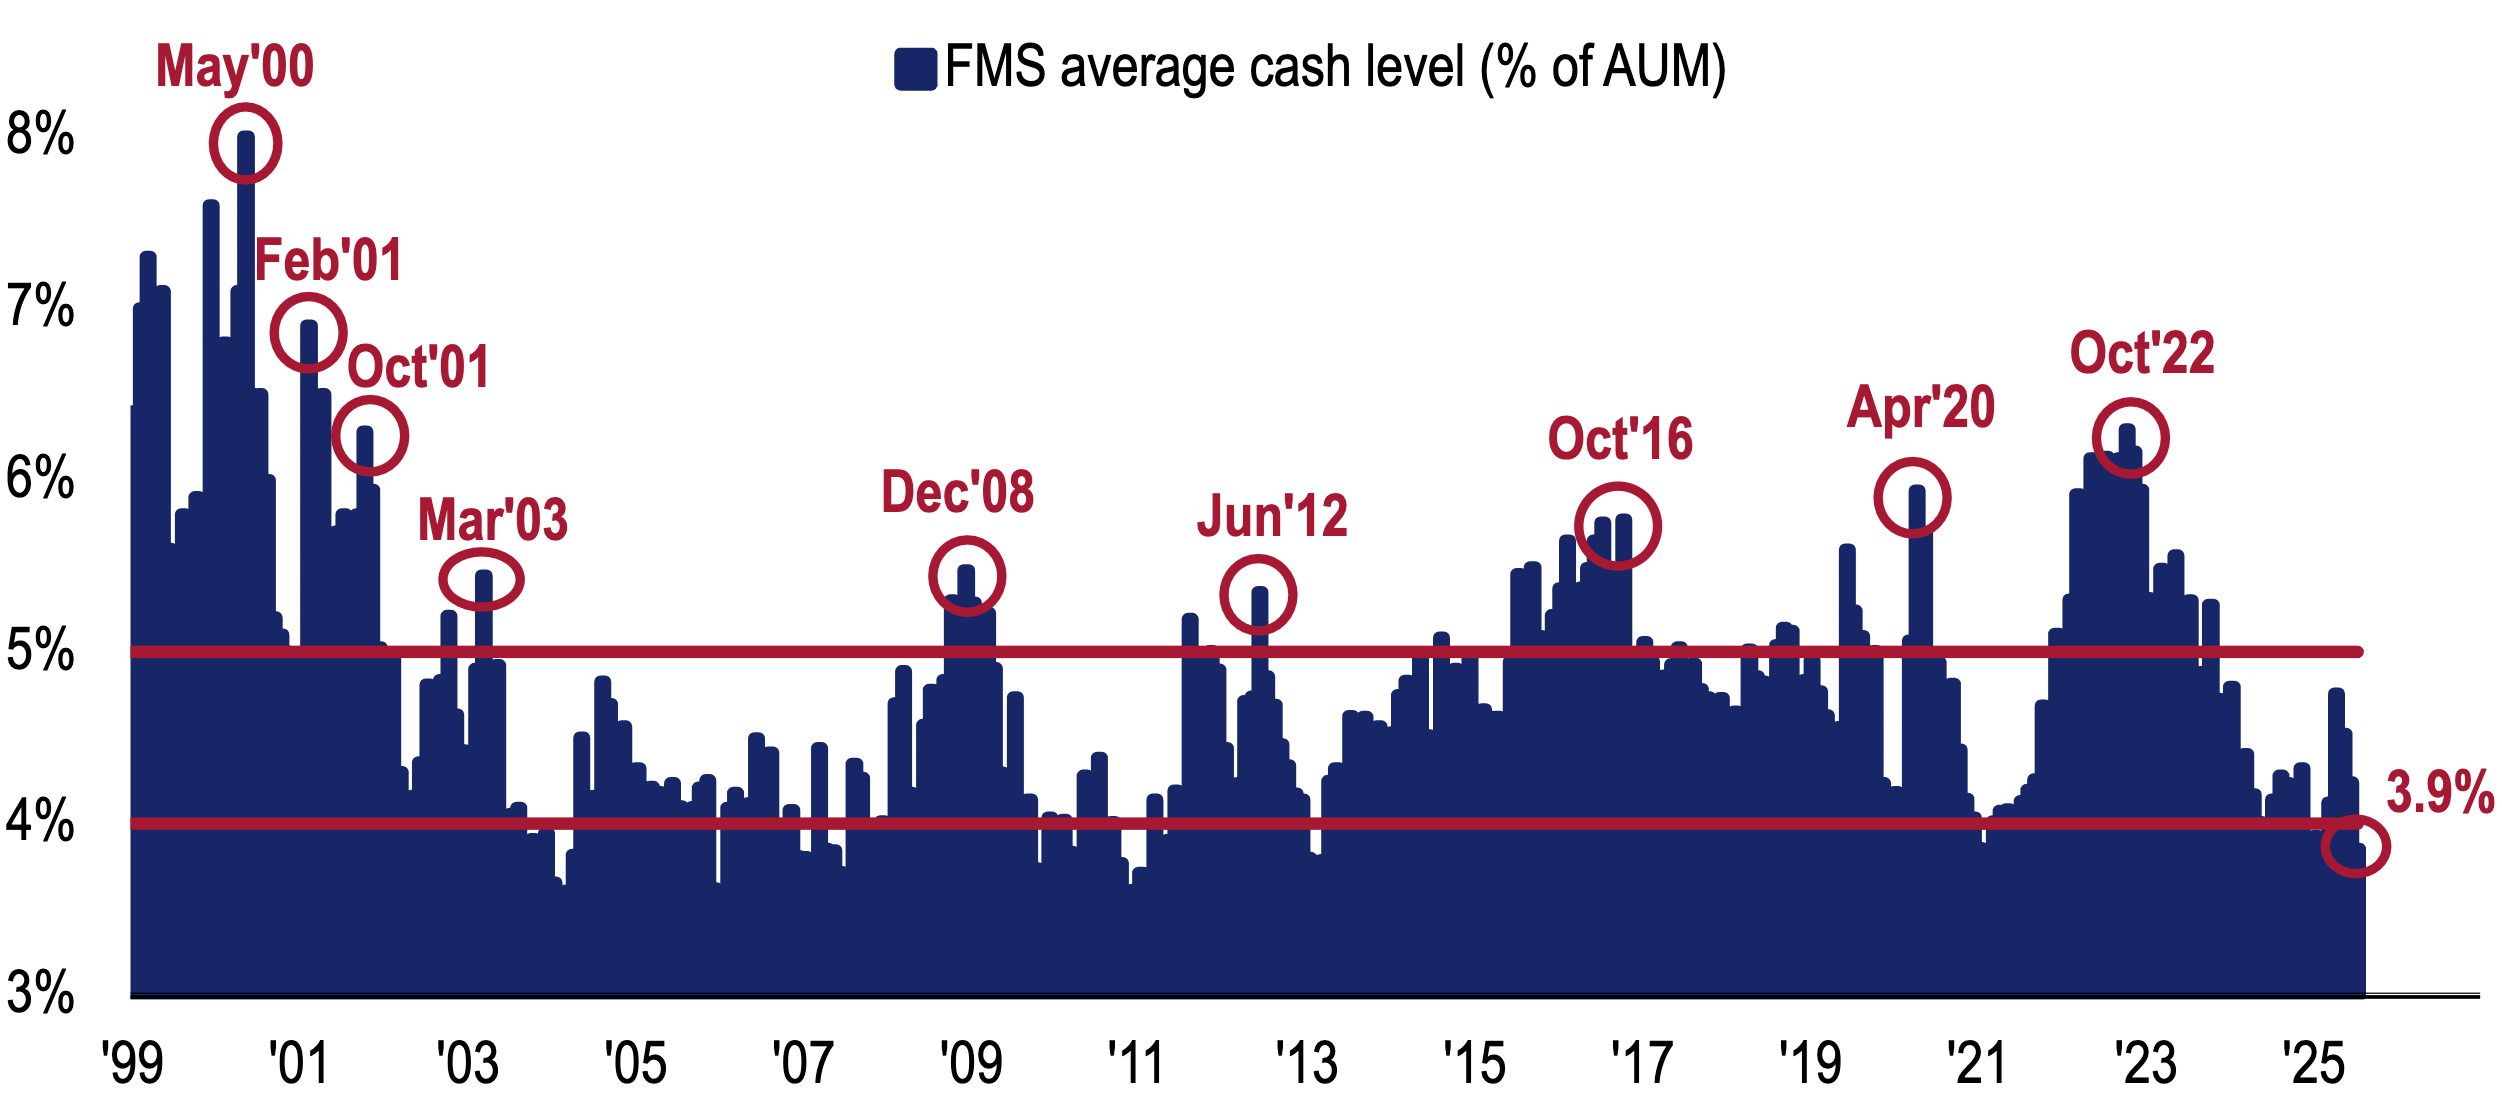
Investor sentiment reached its most bullish level since Feb'25, primarily driven by profit optimism (largest increase since Jul'20) and a surge in risk appetite (record increase over the past 3 months). Cash levels fell to 3.9%, triggering a "sell signal". Historical data shows that after 17 "sell signals" since 2011, the S&P 500's average 4-week decline was -2%. Despite high sentiment, equity overweight is not yet extreme, and bond market volatility remains low, suggesting investors are more likely to hedge and rotate rather than retreat broadly. 投资者情绪达到Feb'25以来最牛市水平,主要受利润乐观情绪(自Jul'20以来最大涨幅)和风险偏好激增(过去3个月创纪录涨幅)推动。现金水平降至3.9%,触发了“卖出信号”。历史数据显示,自2011年以来,17次“卖出信号”后,标普S&P 500平均4周跌幅为-2%。尽管情绪高涨,但股票超配程度尚未达到极端,且债券波动性依然处于低位,作者认为投资者更可能采取对冲和轮动策略,而不是大规模撤退。
Fund Manager Risk Appetite 3-Month Change 基金经理风险偏好3个月变化
BofA Global FMS Investor Sentiment at 5-Month High 美银全球FMS投资者情绪升至5个月高点
FMS Cash Levels Fall to 3.9%, Triggering "Sell Signal"
FMS现金水平降至3.9%,触发“卖出信号”
Policy and Tail Risks 政策与尾部风险
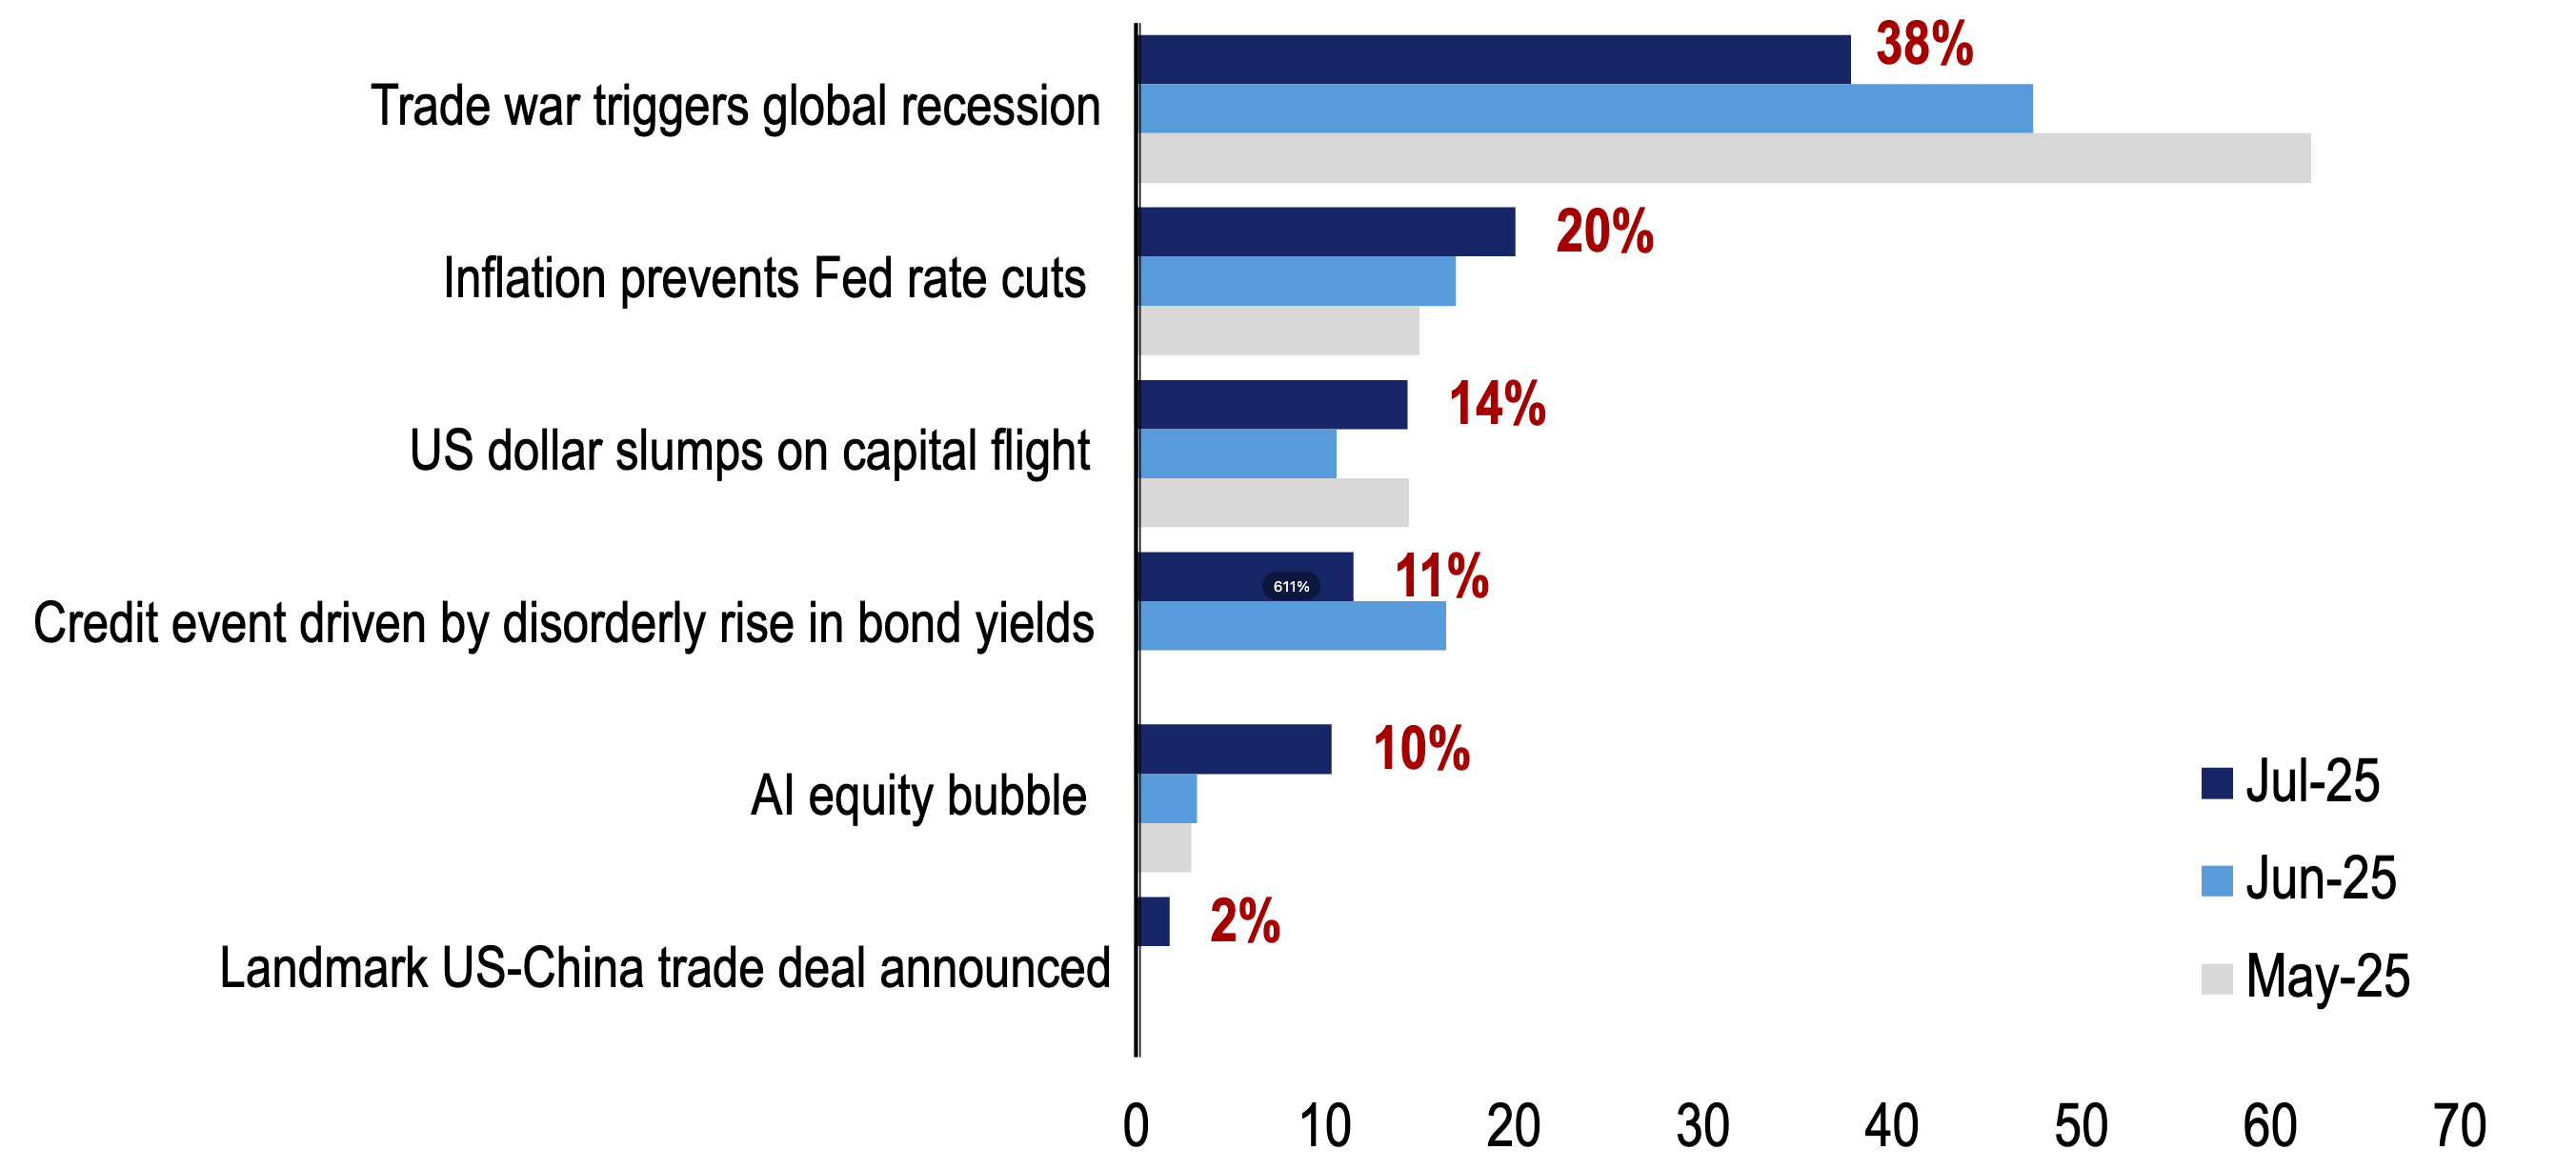
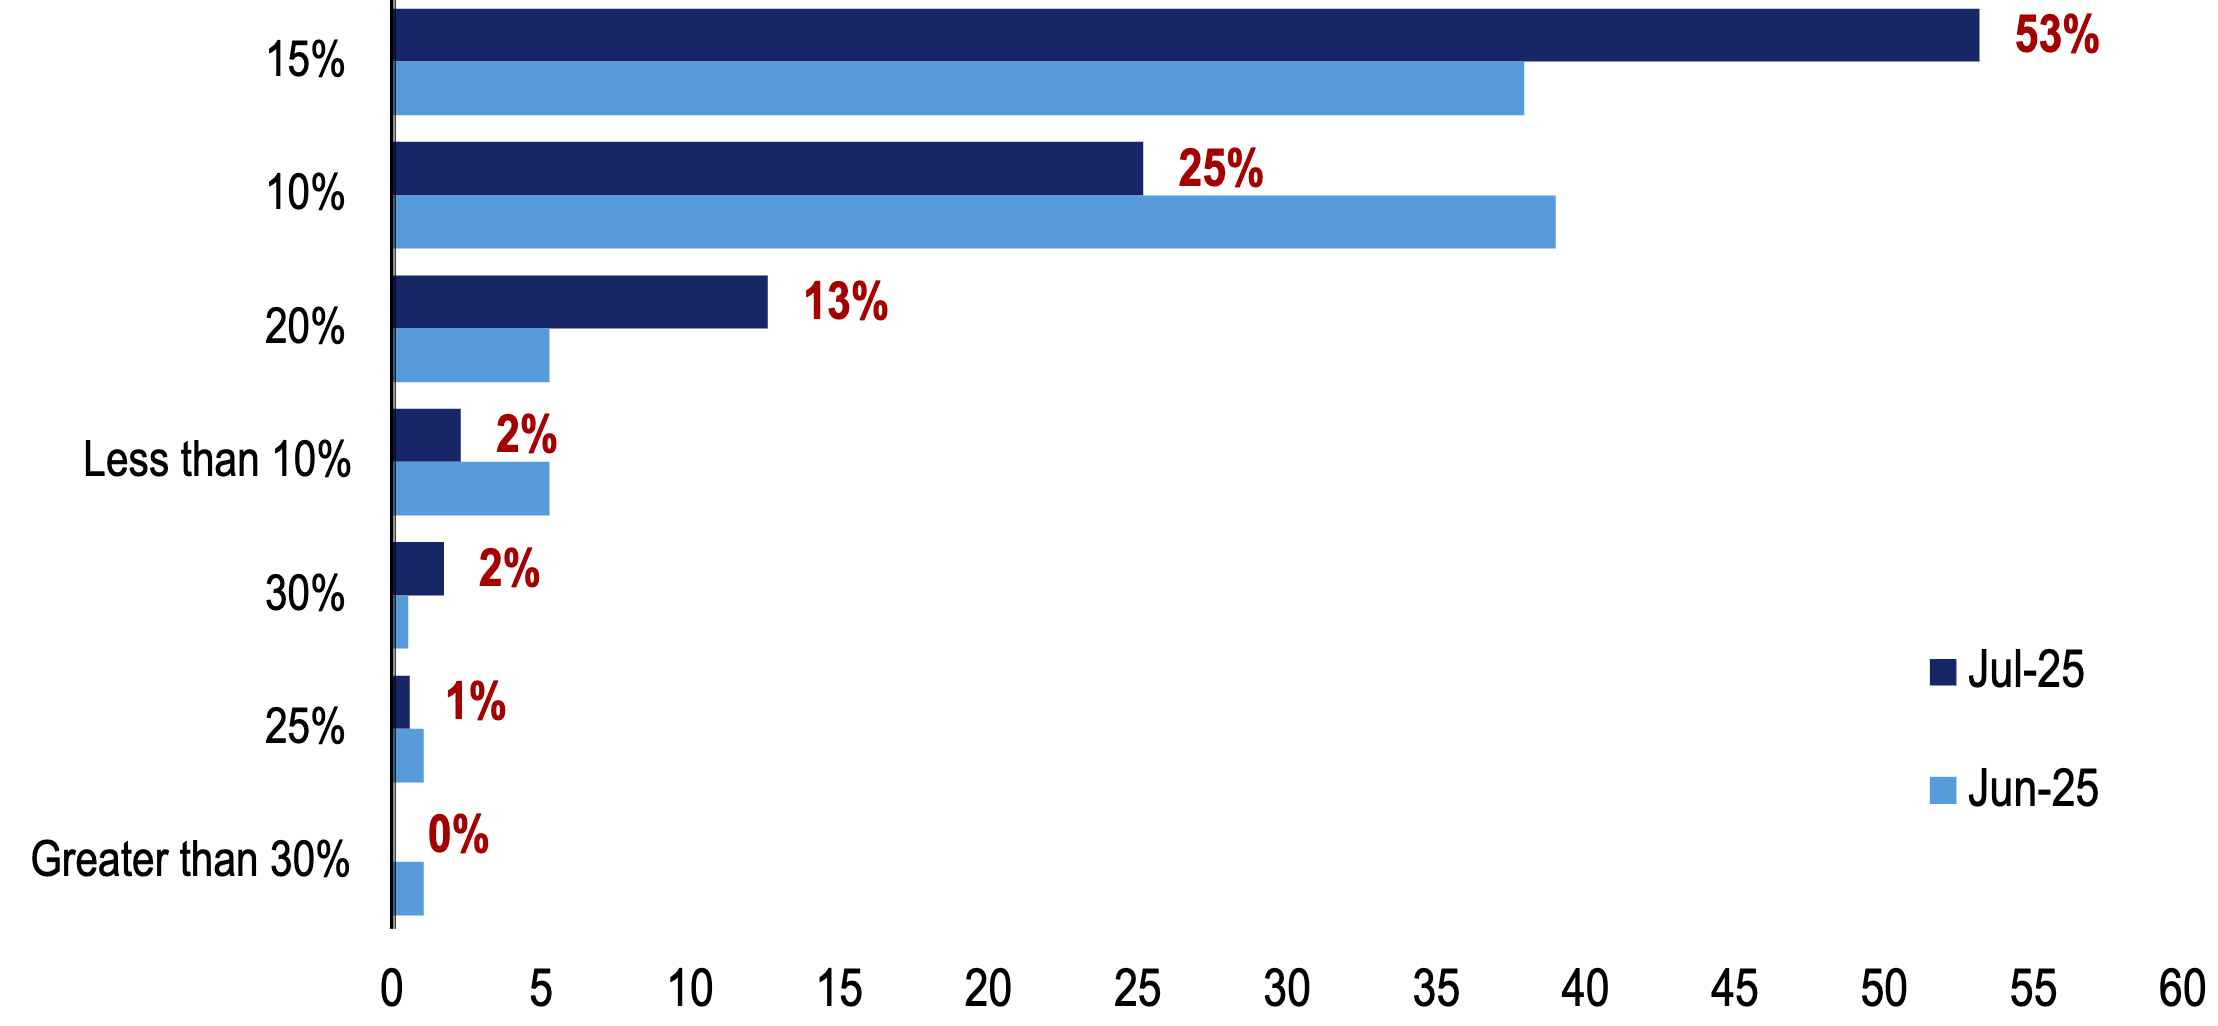
Trade war triggering global recession remains the largest "tail risk" for investors (38%), although the proportion decreased from 47% in Jun. The second largest "tail risk" is inflation preventing Fed rate cuts (20%), with US Dollar collapse causing capital flight ranking third (14%). Investors expect the final tariff rate between the US and the rest of the world to rise to 14% (weighted average response), up from 12% in Jun. 贸易战触发全球衰退依然是投资者最大的“尾部风险”(38%),尽管比例较Jun的47%有所下降。第二大“尾部风险”是通胀阻止Fed降息(20%),US Dollar暴跌引发资本外逃位列第三(14%)。投资者预期美国对全球其余国家的最终关税率将升至14%(加权平均响应),高于Jun的12%。
Trade War Still Largest "Tail Risk" 贸易战仍被视为最大的“尾部风险”
FMS Investors Expect US Tariffs to Reach 14%
FMS投资者预期美国对全球其余国家的最终关税率为14%
Asset Allocation and Crowded Trades 资产配置与热门交易
"Short US Dollar" became the most crowded trade for the first time, displacing "long gold" (Apr'25 and Jun'25) and "long Magnificent Seven" (Apr'23 to Mar'25). “做空US Dollar”首次成为最拥挤交易,取代了此前的“做多黄金”(Apr'25和Jun'25)和“做多Magnificent Seven”(Apr'23至Mar'25)。
"Short US Dollar" Becomes Most Crowded Trade “做空US Dollar”首次成为最拥挤交易
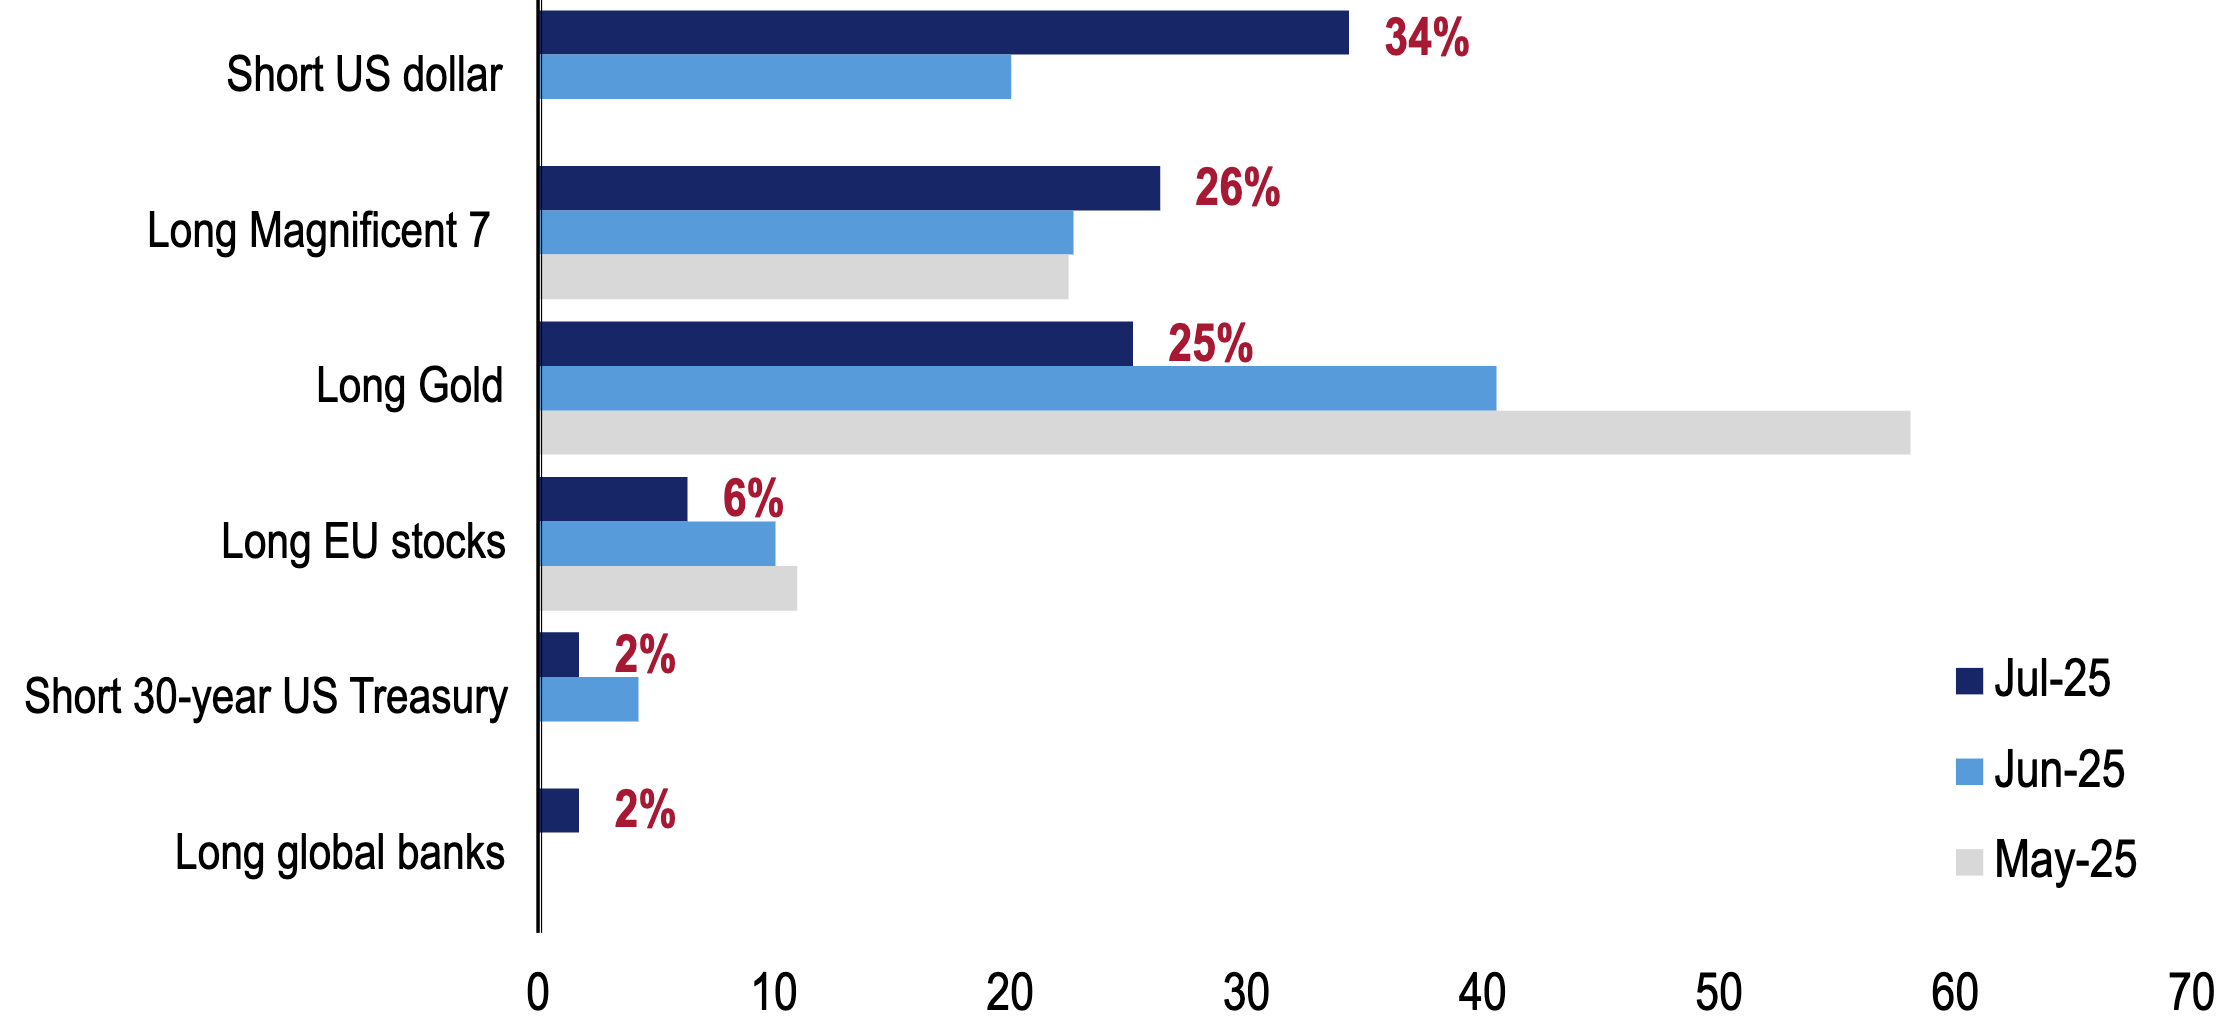
FMS Absolute Positioning (Net Overweight %)
FMS绝对持仓(净超配%)
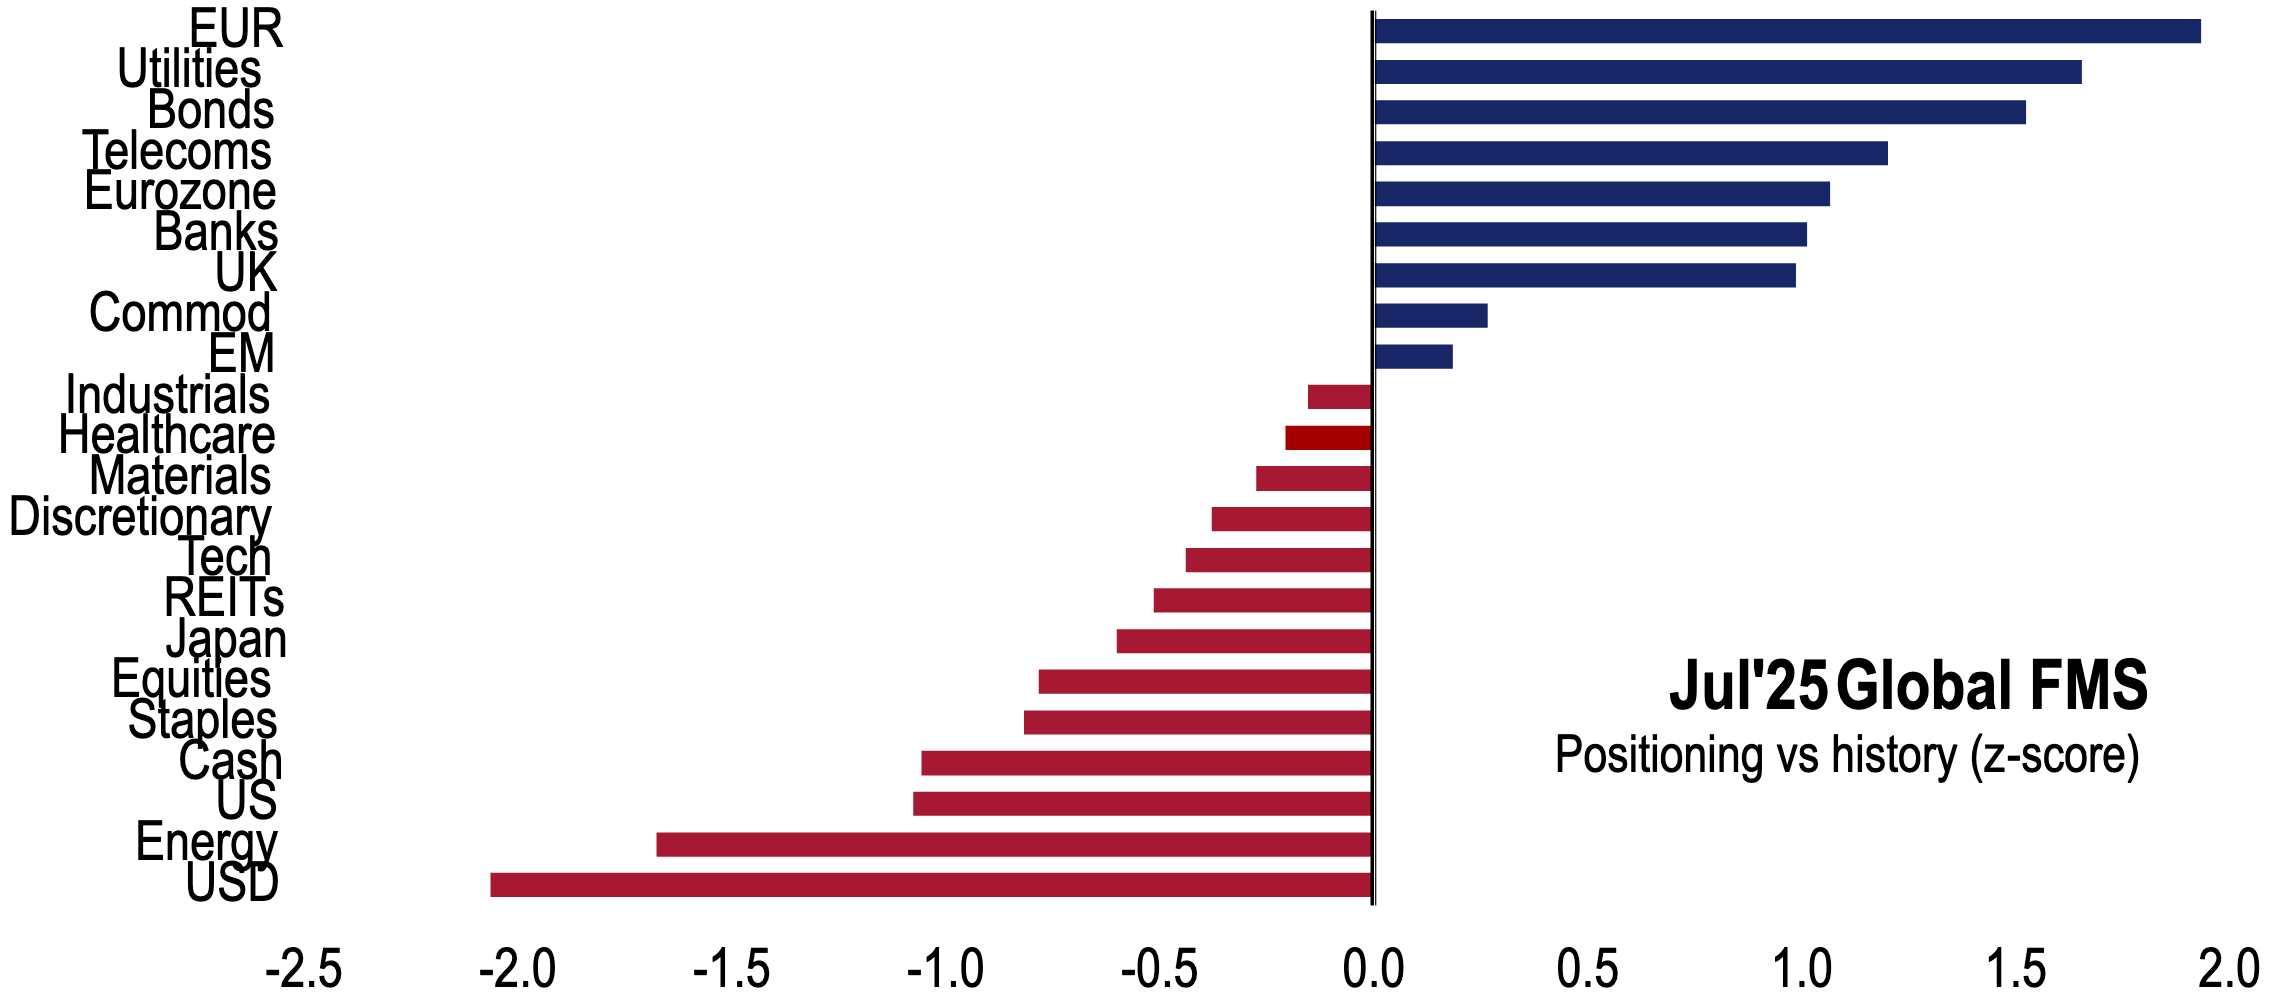
FMS Historical Positioning (z-score)
FMS相对于历史的头寸(z-score)
Industry Allocation 行业配置
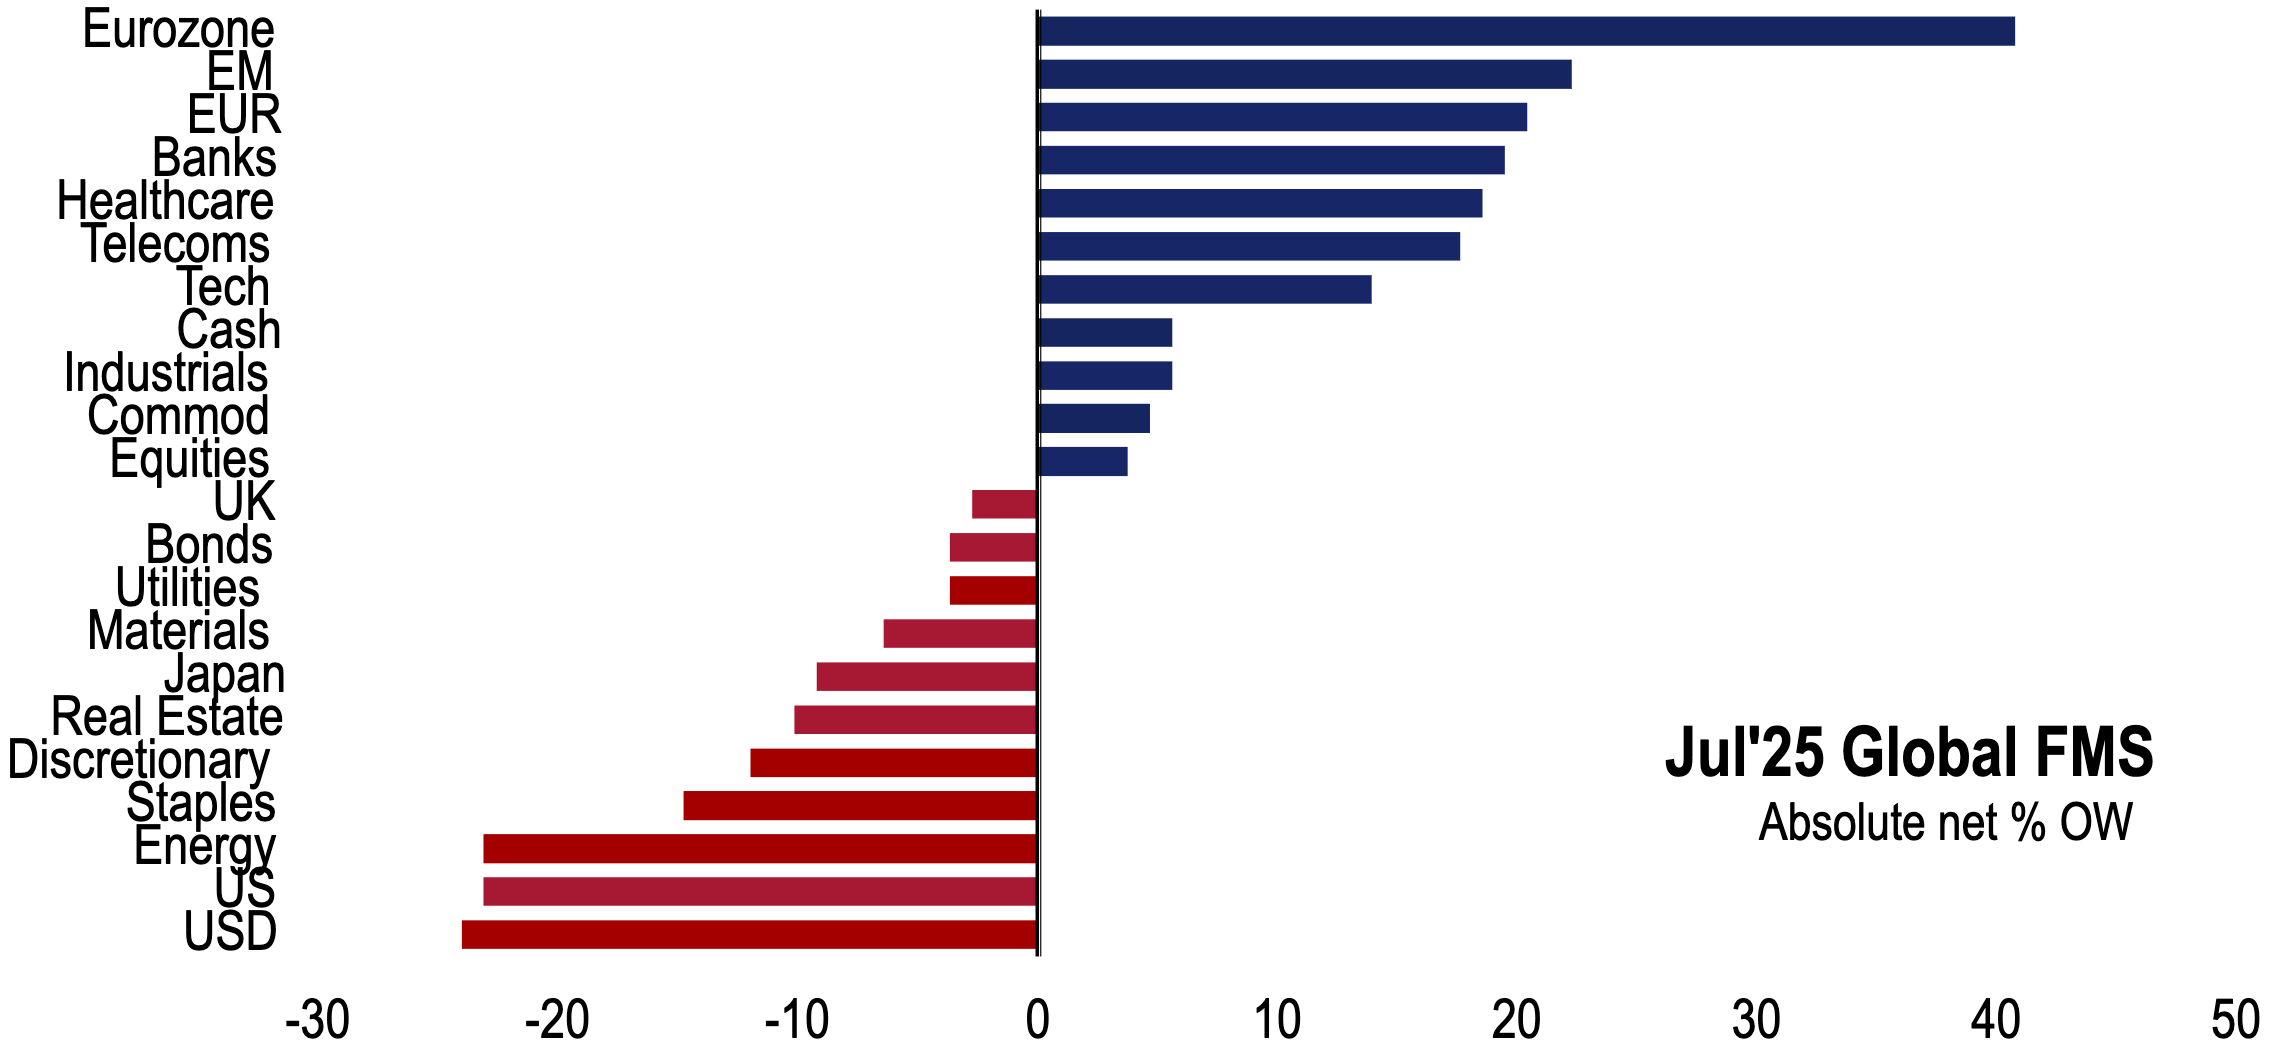
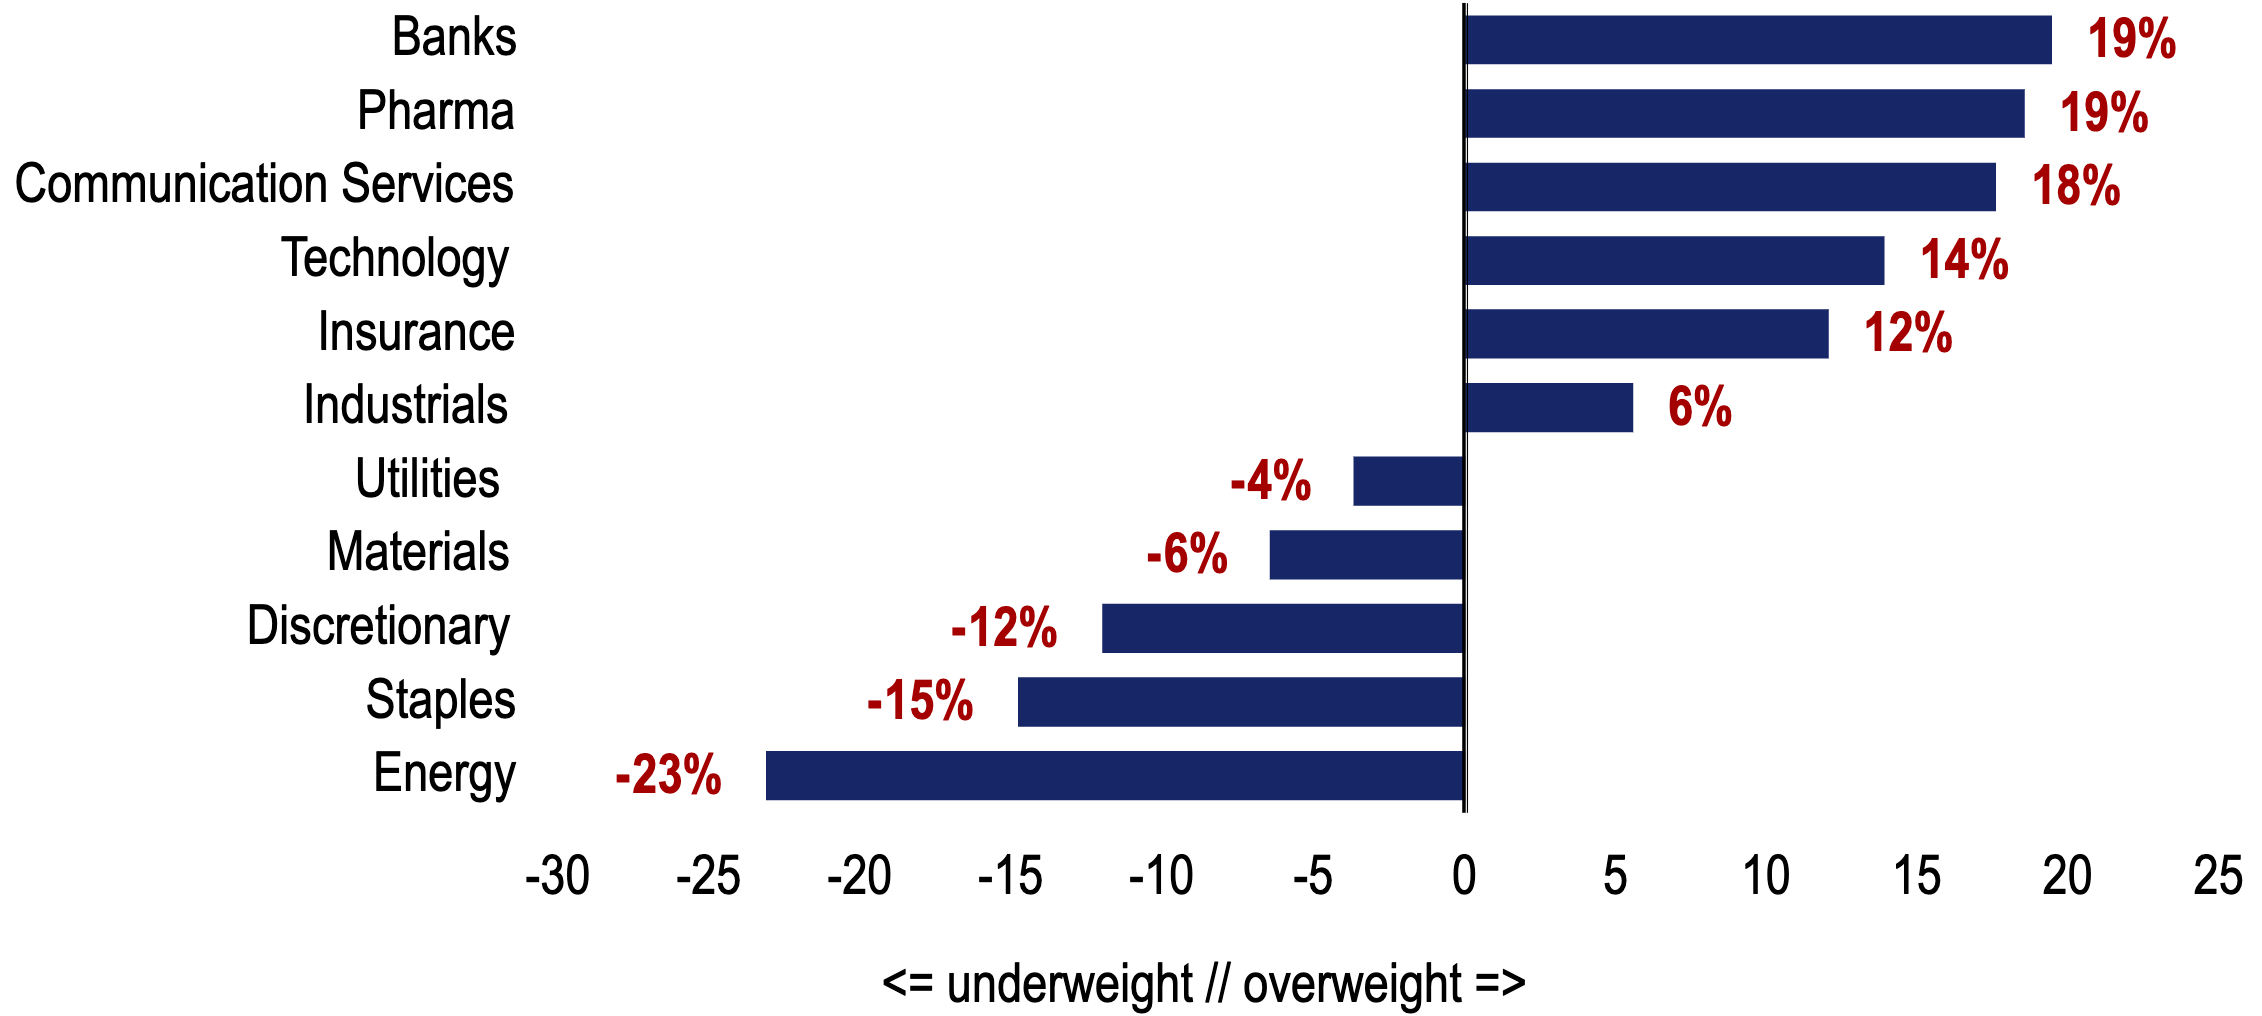
In July FMS, investors increased allocations to Technology, Materials, Telecommunications, and Consumer Discretionary, while reducing allocations to Consumer Staples and Banks. Currently, FMS investors are most overweight in Banks, Healthcare, and Telecommunications, and most underweight in Energy, Consumer Staples, and Consumer Discretionary. 7月FMS投资者增加了对Technology、Materials、Telecommunications和Consumer Discretionary的配置,减少了对Consumer Staples和Banks的配置。目前FMS投资者净超配最多的是Banks、Healthcare和Telecommunications,净低配最多的是Energy、Consumer Staples和Consumer Discretionary。
Global Sector Sentiment
全球行业情绪
Rates, Credit, FX & Commodities 利率、信用、外汇与大宗商品
Credit Market Performance 信用市场表现
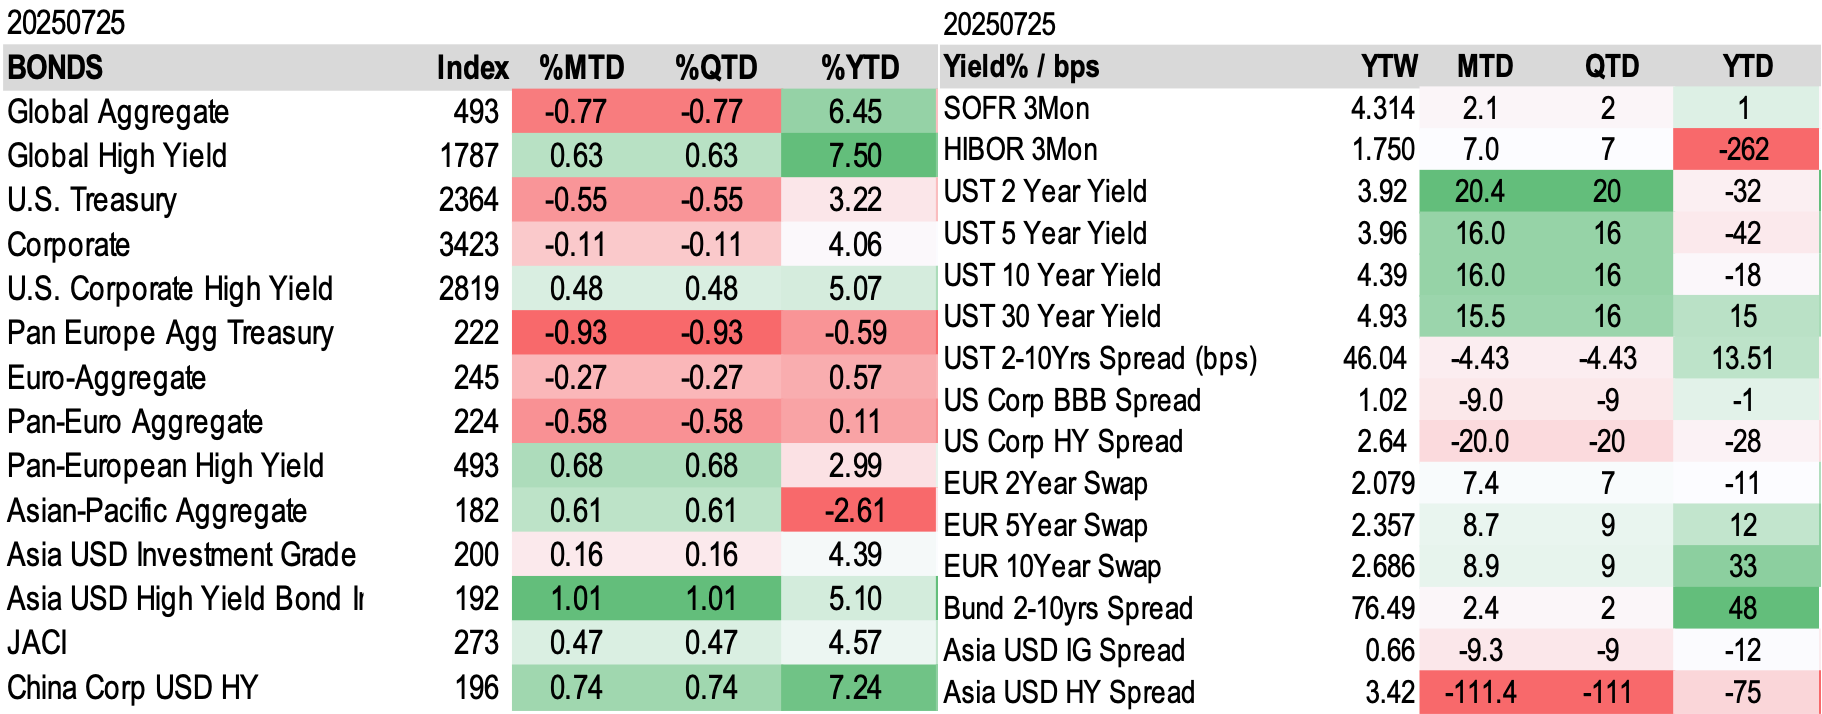
Credit Spread 信用利差
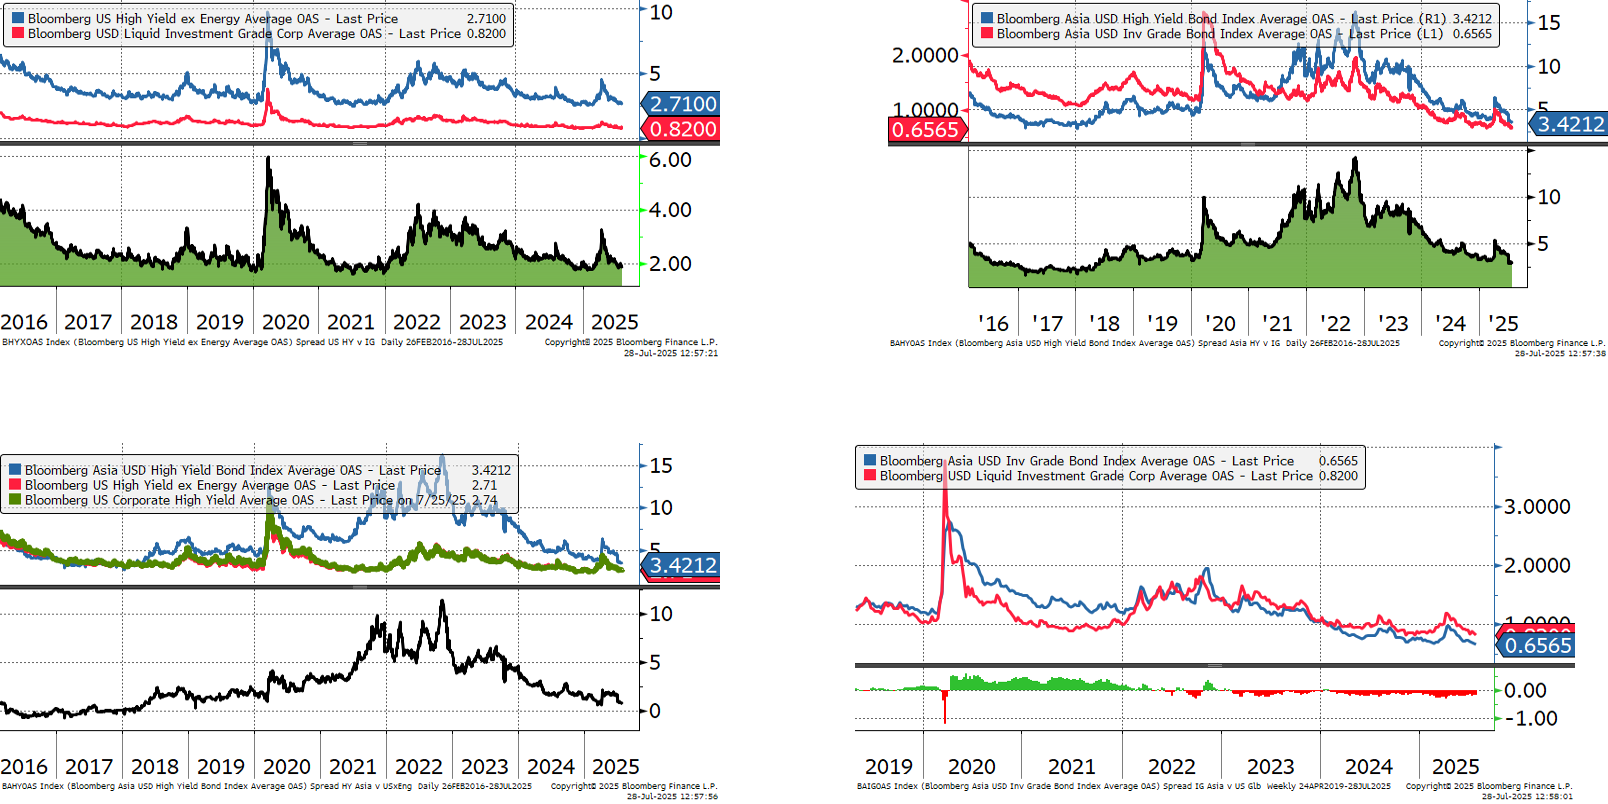
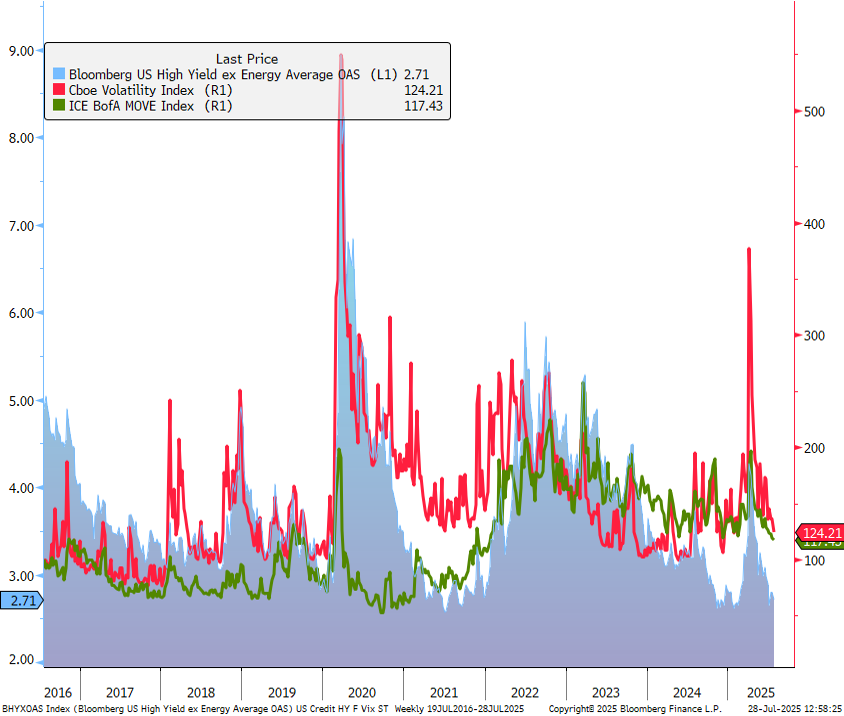
US Credit Spread Analysis: Sentiment Driver 美国信用利差分析:情绪驱动因素
US HY Sentiment – Long Term
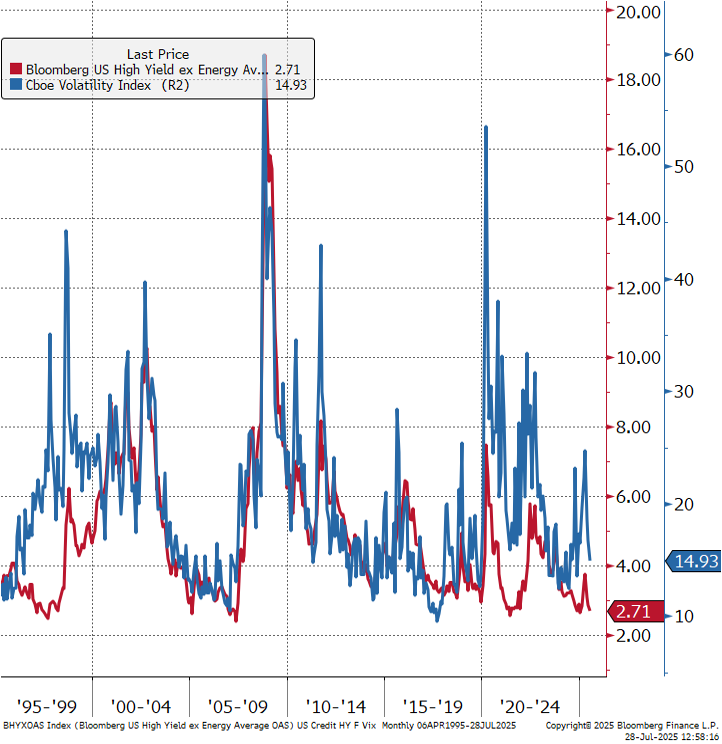
US HY Sentiment – Short Term
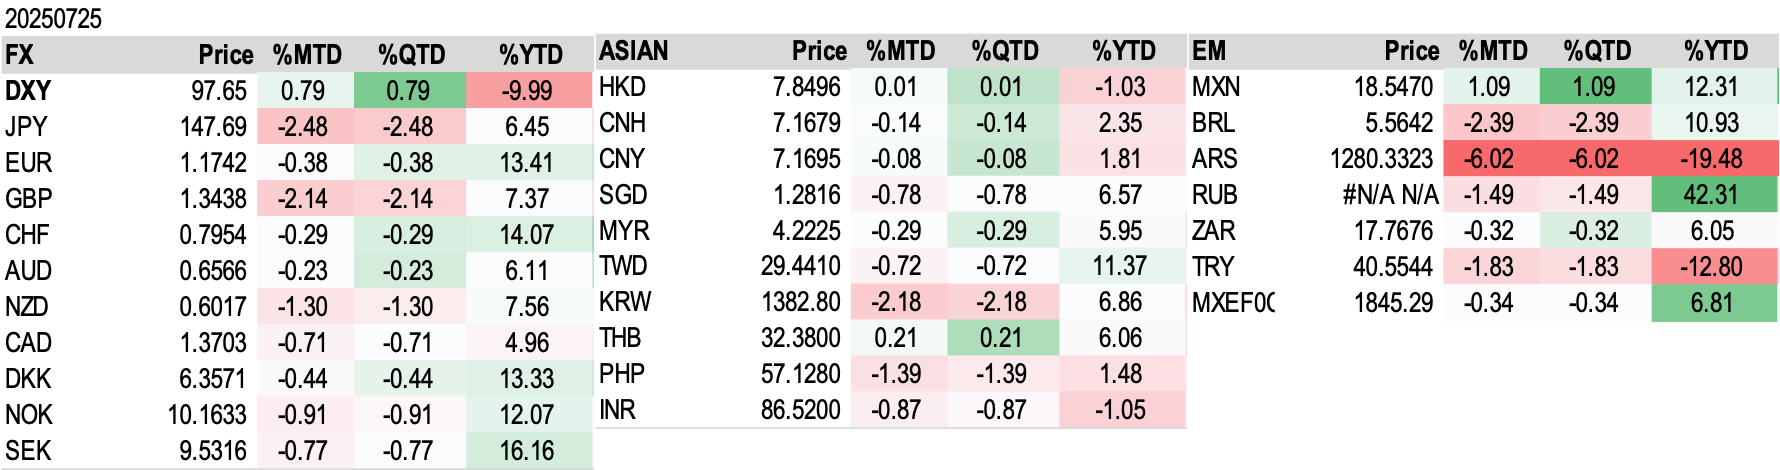
Foreign Exchange Market Performance 外汇市场表现
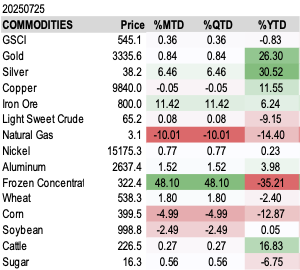
Commodities Performance 大宗商品表现