2025 W31 Market Review
A comprehensive overview of global market performance and key narratives for Week 30.
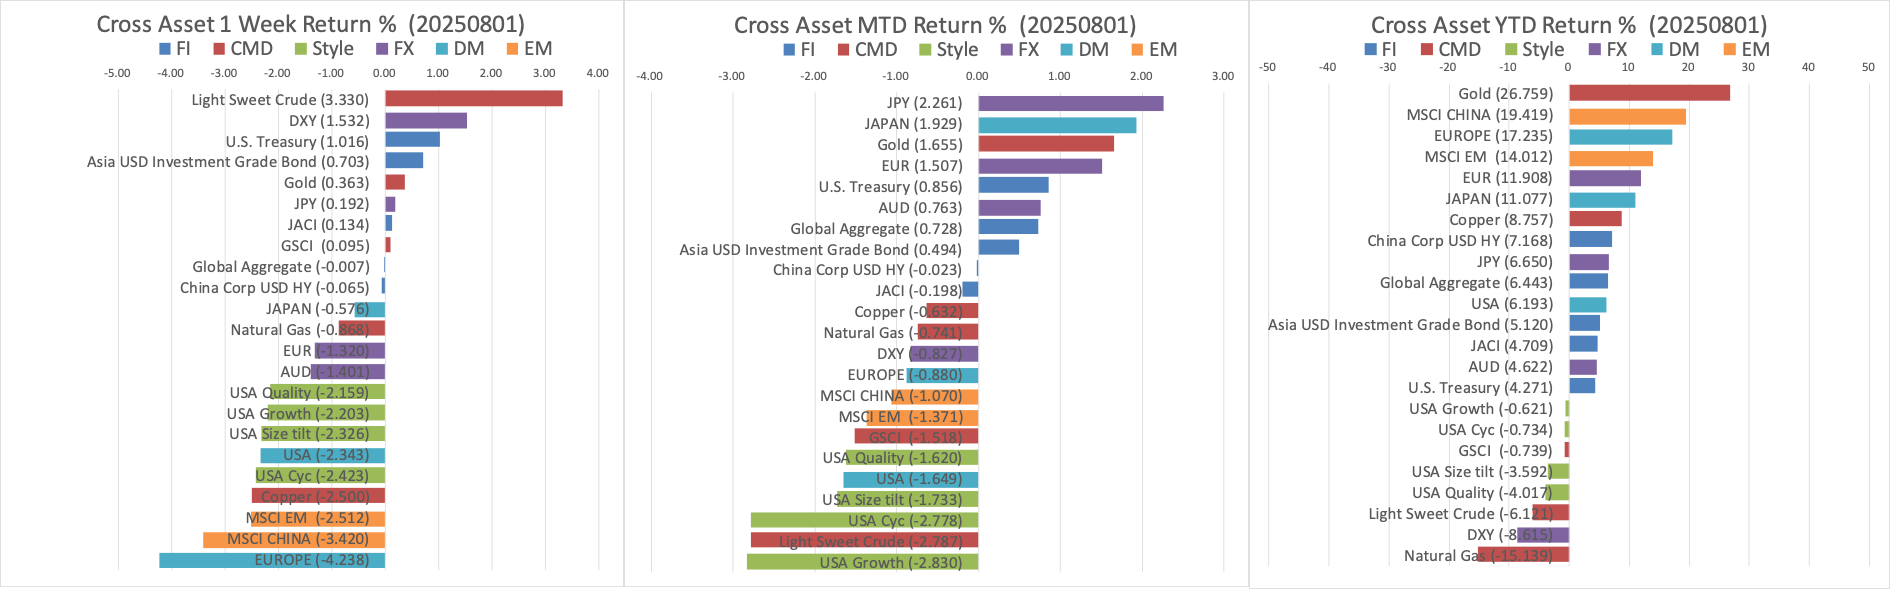
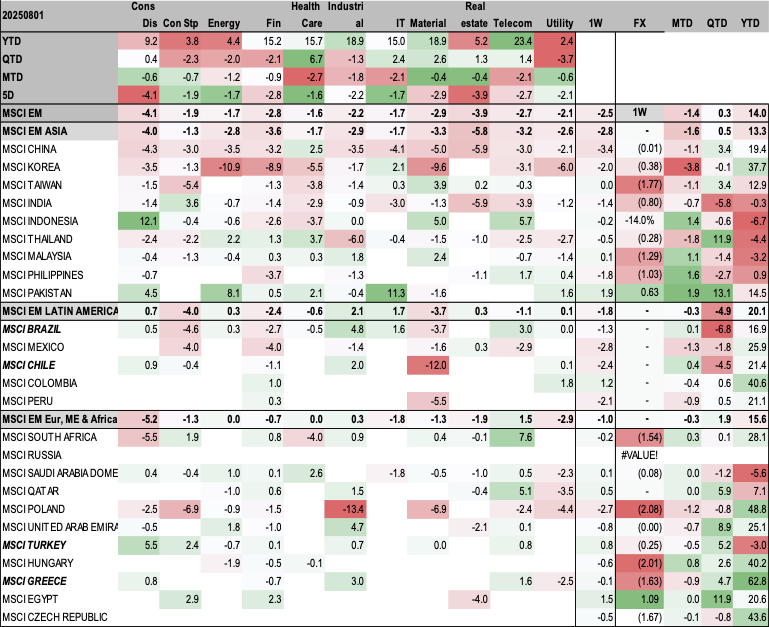
Cross Assets Performance
Markets Narratives
Macro Overview
- U.S. job growth slowed significantly in July (only 73,000 jobs added), with May and June data revised down by 258,000. Unemployment rate ticked up to 4.2%.
- U.S. inflation accelerated in June: Core PCE rose 0.3% MoM and 2.8% YoY. Q2 GDP grew 3%.
- Eurozone data showed steady but stagnant economy: Q2 GDP expanded 0.1%, headline inflation held at 2.0%, core inflation at 2.3%. Jobless rate remained 6.2% in June.
- Japan's industrial production rose 1.7% MoM in June, retail sales up 2.0% YoY. BoJ revised up fiscal 2025 core CPI forecast to 2.7%.
- China's manufacturing PMI contracted in July (S&P Global at 49.5, official at 49.3). Economy could see slower growth due to weak domestic demand and trade uncertainty.
- China's housing market remains weak: New home prices fell 0.27% MoM, existing home values fell 0.61%, and residential sales dropped 12.6% YoY in June.
Policy Developments
- U.S. President Donald Trump signed an executive order to raise tariffs on most U.S. trading partners, effective August 7. New trade deals with EU and South Korea, and 90-day extension for Mexico.
- Federal Reserve held rates steady at 4.25% to 4.50% for the fifth consecutive meeting. Market expectations for a September rate cut lowered after Powell's press conference.
- EU and U.S. reached a framework trade deal, with a 15% tariff on most European exports to the U.S. (half of initial mooted rate).
- Bank of Japan kept key interest rate unchanged at 0.5%. Governor Ueda hinted at potential rate hike later this year.
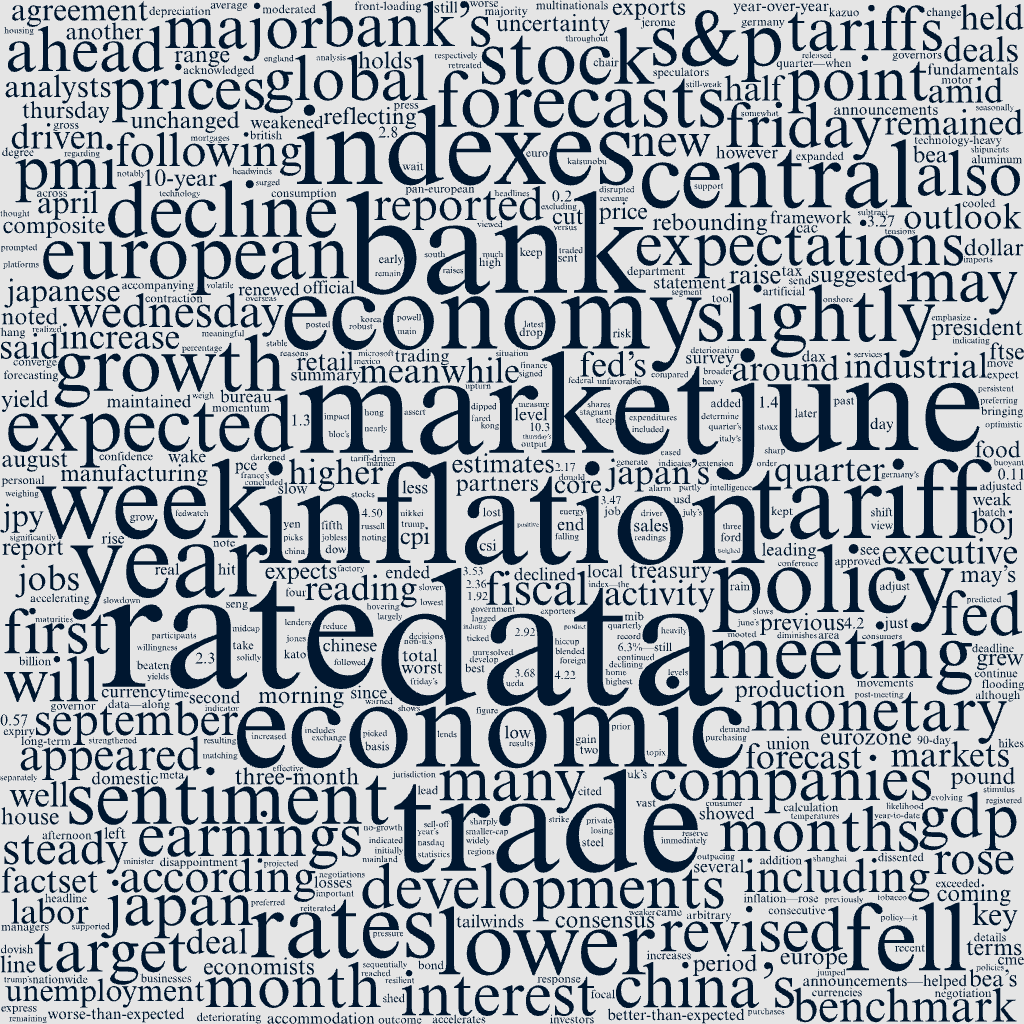
Market Narratives WordCloud
Overall Equity Market Performance
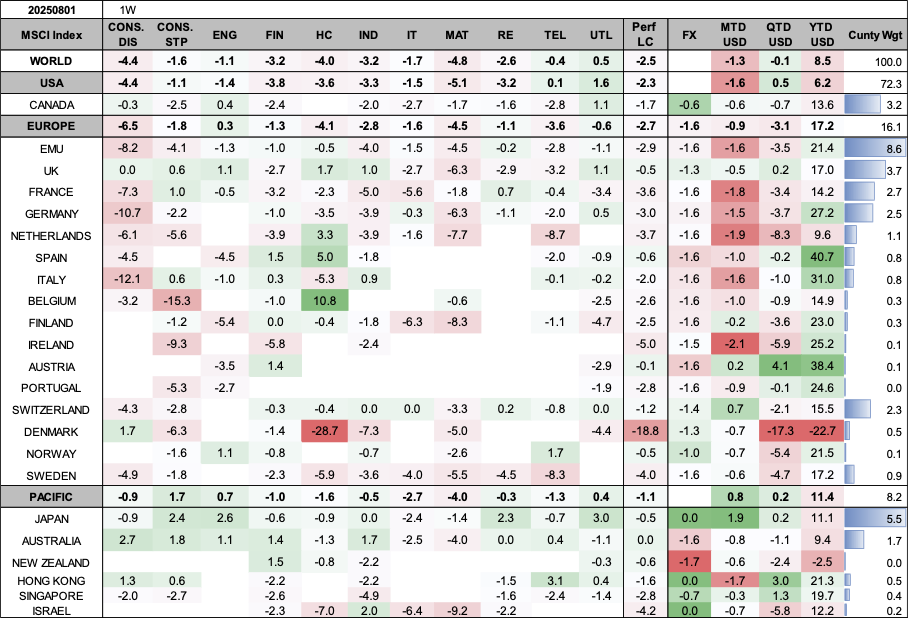

Market Review By Country
US Market Executive Summary
U.S. job growth slows in July; May and June data revised lower.
Key Market & Economic Data
Russell 2000
-4.17%
S&P MidCap 400
-3.53%
Dow Jones Ind. Avg.
-2.92%
S&P 500 Index
-2.36%
Nasdaq Composite
-2.17%
Fed Policy Rate
4.25%-4.50%
June Core PCE (MoM)
+0.3%
Q2 GDP Growth
+3%
July Jobs Added
+73,000
Unemployment Rate (July)
+4.2%
10-Year US Treasury Yield
4.22%
Stocks decline on renewed tariffs, trade policy uncertainty, and weak economic data
U.S. stock indexes posted losses in what ended as the worst week for some indexes since the tariff-driven sell-off in early April. Smaller-cap indexes fared worst as the Russell 2000 and S&P MidCap 400 indexes fell 4.17% and 3.53%, respectively, followed by the Dow Jones Industrial Average (down 2.92%) and S&P 500 Index (down 2.36%). The technology-heavy Nasdaq Composite held up best (down 2.17%) and maintained its year-to-date lead over the other major indexes.
Trade deals and tariffs were a major driver of sentiment throughout the week leading up to President Donald Trump’s arbitrary August 1 deadline for new deals. On Thursday, President Trump signed an executive order to raise tariffs on the vast majority of U.S. trading partners, effective August 7, which appeared to weigh heavily on stock indexes Friday morning. Other announcements during the week included new deals with several trading partners, including the European Union (EU) and South Korea, as well as another 90-day negotiation period extension for Mexico.
Earnings headlines were another major focal point during the week. According to data from FactSet, of the 66% of S&P 500 companies that have reported through Friday morning, 82% have beaten consensus earnings estimates, with a blended earnings growth rate of 10.3%. However, several companies warned that tariff headwinds are weighing on their businesses, including Ford Motor, which said it expects to take a USD 2 billion hit from tariffs this year. Meanwhile, shares of Microsoft and Meta Platforms both traded higher in the wake of their better-than-expected results, with both companies noting tailwinds from artificial intelligence.
Fed holds rates steady for fifth consecutive meeting; inflation accelerates
The Federal Reserve concluded its July monetary policy meeting on Wednesday and, as was widely expected, maintained its target policy rate at a range of 4.25% to 4.50%. Notably, two Fed governors dissented, preferring to immediately lower rates by a quarter point, and the central bank’s post-meeting statement noted that “economic activity moderated in the first half of the year,” which some market participants viewed as dovish developments.
However, in a press conference following the meeting, Fed Chair Jerome Powell noted that inflation remained above the Fed’s target and reiterated the central bank’s willingness to wait for data to determine monetary policy decisions, which appeared to shift market sentiment and sent expectations for a September rate cut lower on Wednesday afternoon.
Meanwhile, data released by the Bureau of Economic Analysis (BEA) on Thursday indicated that inflation picked up in June. The BEA’s core personal consumption expenditures (PCE) index—the Fed’s preferred measure of inflation—rose 0.3% month over month in June, accelerating from May’s reading of 0.2%. On a year-over-year basis, prices rose 2.8%, remaining solidly ahead of the Fed’s long-term inflation target of 2%.
The BEA also reported that the U.S. economy grew 3% in the second quarter, a sharp increase from the first quarter’s 0.5% decline, largely driven by a steep drop in imports, which subtract from the BEA’s calculation of gross domestic product (GDP).
July jobs report shows deteriorating labor market
On Friday, the Labor Department reported that the U.S. economy added only 73,000 jobs in July, well below consensus estimates for a gain of around 115,000. The readings for May and June were also revised down by a total of 258,000, bringing the three-month total to just 106,000 jobs, indicating that the labor market has cooled much more significantly than many had thought in recent months. The unemployment rate ticked up to 4.2%, in line with estimates. According to the CME FedWatch tool, market expectations for a rate cut in September jumped in response to the report, rebounding sharply after declining in the wake of the Fed meeting on Wednesday.
The worse-than-expected data—along with new tariff announcements—helped send U.S. Treasury yields across most maturities lower on Friday, with the yield on the benchmark 10-year U.S. Treasury note falling nearly 0.16 percentage point to 4.22%.
Europe Market Executive Summary
Key Market & Economic Data
STOXX Europe 600
-2.57%
France’s CAC 40
-3.68%
Germany’s DAX
-3.27%
Italy’s FTSE MIB
-1.92%
UK’s FTSE 100
-0.57%
Eurozone Headline Inf. (July)
+2.0%
Eurozone Core Inf. (July)
+2.3%
Eurozone Q2 GDP Growth
+0.1%
Eurozone Jobless Rate (June)
6.2%
UK House Price Index (July)
+0.6%
In local currency terms, the pan-European STOXX Europe 600 Index ended 2.57% lower amid disappointment with the framework trade deal between the U.S. and the EU. Major stock indexes fell. France’s CAC 40 Index declined 3.68%, Germany’s DAX lost 3.27%, and Italy’s FTSE MIB dipped 1.92%. The UK’s FTSE 100 Index eased 0.57%, partly supported by the depreciation of the UK pound against the U.S. dollar. A weaker pound lends support to the index because many of its companies are multinationals that generate meaningful overseas revenue.
Eurozone data point to steady but still stagnant economy
Resilient eurozone data for GDP, inflation, and economic sentiment appeared to reduce pressure on the European Central Bank to lower interest rates again. Headline inflation held steady at 2.0% in July, matching the European Central Bank’s target but coming in slightly higher than the 1.9% predicted by analysts. Core inflation, excluding volatile energy, food, and tobacco prices, held at 2.3%. Meanwhile, GDP expanded 0.1% in the second quarter compared with the previous three months. While the growth rate was less than the 0.6% registered in the first quarter—when exports surged ahead of a change in U.S. tariff policy—it exceeded the no-growth outcome forecast by analysts in a FactSet survey. Year over year, economic output grew 1.4%, slightly less than the 1.5% in the same period of 2024 but more than a projected 1.3%.
Separately, the jobless rate in the euro area remained at a record low of 6.2% in June, unchanged from May’s figure. In Germany, the seasonally adjusted unemployment rate remained at 6.3%—still the highest level since September 2020. In addition, the bloc’s economic sentiment indicator strengthened in July, with the upturn driven by higher confidence in industry, services, and retail trade. Consumers were slightly more optimistic as well.
UK housing market picks up after tax expiry hiccup
The UK Nationwide House Price Index in July rose 0.6% sequentially, rebounding from a 0.9% decline in June. Bank of England data showed that British lenders approved more mortgages for house purchases than expected in July.
EU and U.S. strike trade deal
The European Union and the U.S. reached a framework deal on trade, although many key details remain unresolved. The agreement includes a 15% tariff on most European exports to the U.S., half the rate initially mooted. The U.S. will keep a 50% tariff on steel and aluminum for the time being.
Japan Market Executive Summary
Key Market & Economic Data
Nikkei 225 Index
-1.58%
TOPIX Index
-0.11%
10-Year JGB Yield
1.55%
JPY/USD Rate
~JPY 150
BoJ Key Rate
0.5%
FY25 Core CPI Forecast
+2.7%
FY25 Real GDP Forecast
+0.6%
June Industrial Prod. (MoM)
+1.7%
June Retail Sales (YoY)
+2.0%
Japan’s stock markets fell over the week, with the Nikkei 225 Index losing 1.58% and the broader TOPIX Index down 0.11%. The Japanese technology segment was weak amid some unfavorable earnings developments, and renewed global trade tensions weighed on sentiment. The yield on the 10-year Japanese government bond fell to 1.55% from 1.59% at the end of the previous week.
The yen weakened past JPY 150 against the U.S. dollar, from the JPY 147 range at the end of the prior week, hovering around its lowest levels in four months. This prompted Japan’s Finance Minister Katsunobu Kato to express alarm at foreign exchange movements, including those driven by speculators, and to again emphasize that it is important for currencies to move in a stable manner reflecting fundamentals.
Bank of Japan holds rates, raises inflation forecasts
As expected, the Bank of Japan (BoJ) left its key interest rate unchanged at 0.5% at its July 30–31 monetary policy meeting. In its quarterly outlook, the central bank revised up its expectations for inflation, forecasting that the core consumer price index (CPI) will increase 2.7% in fiscal 2025, up from the 2.2% forecast in April, reflecting persistent increases in food prices. It also revised up slightly its CPI forecasts for fiscal 2026 and 2027. The bank expects real GDP to grow 0.6% in fiscal 2025, up slightly from the 0.5% previously forecast.
The bank cited as a main risk the evolving situation regarding trade and other policies in each jurisdiction but acknowledged positive developments such as the negotiations between Japan and the U.S. resulting in an agreement. BoJ Governor Kazuo Ueda said that the likelihood of the bank’s outlook being realized has increased somewhat, leading some investors to converge around the view that the central bank could raise interest rates later this year. The bank continued to assert that if economic activity and prices develop in line with its forecasts, it will continue to raise the policy interest rate and adjust the degree of monetary accommodation.
Robust industrial production and retail sales in June
In economic data developments, Japan’s industrial production rose 1.7% month over month in June, outpacing market expectations of a 0.6% decline and following a 0.1% decline in May. Retail sales rose 2.0% year on year in June, ahead of an expected 1.8% increase and following a 1.9% rise in May.
China Market Executive Summary
Key Market & Economic Data
CSI 300 Index
-1.75%
Shanghai Composite
-0.94%
Hang Seng Index
-3.47%
S&P Global PMI (July)
49.5
Official PMI (July)
49.3
Mainland Chinese stock markets retreated after the new U.S. tariff rates darkened the global growth outlook and a batch of data suggested a slowdown in China’s economy. The onshore benchmark CSI 300 Index declined 1.75% and the Shanghai Composite Index shed 0.94% in local currency terms, according to FactSet. In Hong Kong, the benchmark Hang Seng Index fell 3.47%.
The S&P Global manufacturing purchasing managers’ index (PMI) for China fell to 49.5 in July, below the 50 level that indicates a contraction, versus June’s 50.4 reading. Friday’s S&P reading, a private survey, was worse than economists’ forecasts and came a day after the official PMI showed that factory activity weakened to 49.3 in July, a three-month low. The official PMI also lagged forecasts. High temperatures, heavy rain, and flooding in some regions that disrupted manufacturing were the reasons for July’s deterioration, China’s statistics bureau said in a statement accompanying Thursday’s data.
The latest PMI data suggested that China’s economy could see slower growth in the coming months amid still-weak domestic demand and global trade uncertainty. Front-loading by Chinese exporters ahead of expected U.S. tariff hikes, shipments to non-U.S. markets, and fiscal stimulus at home kept China’s economy buoyant in the year’s first half. But many economists expect that the momentum in the economy will slow as the impact of these tailwinds diminishes.
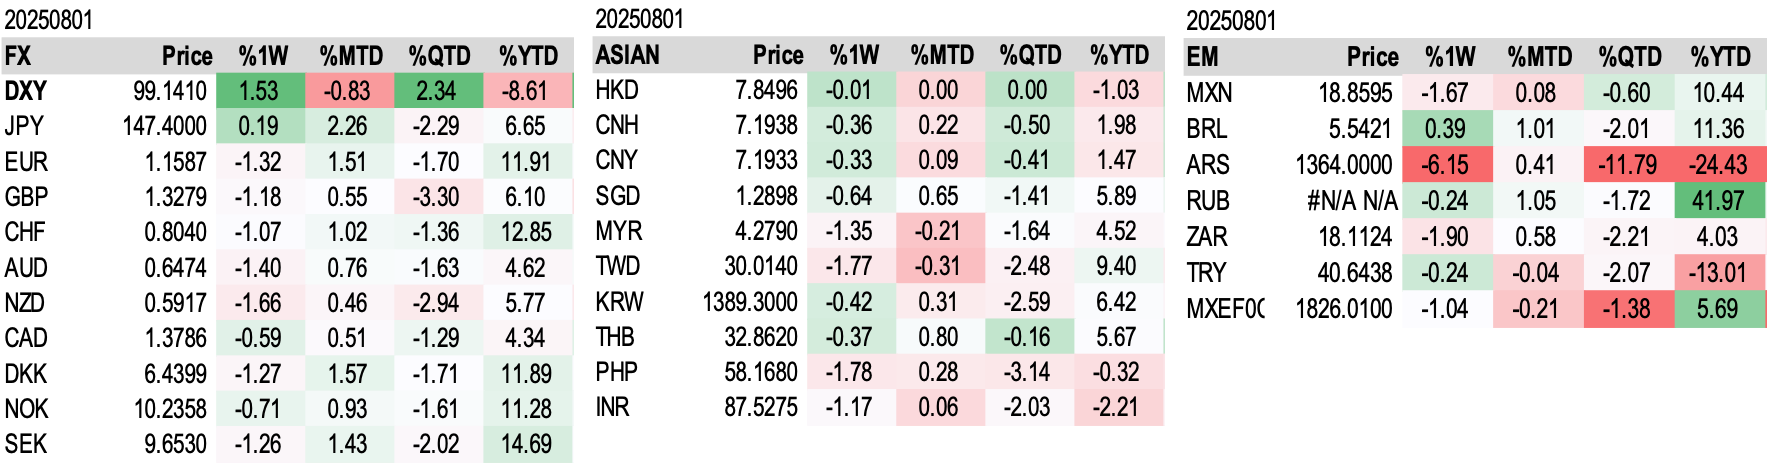
Foreign Exchange Performance
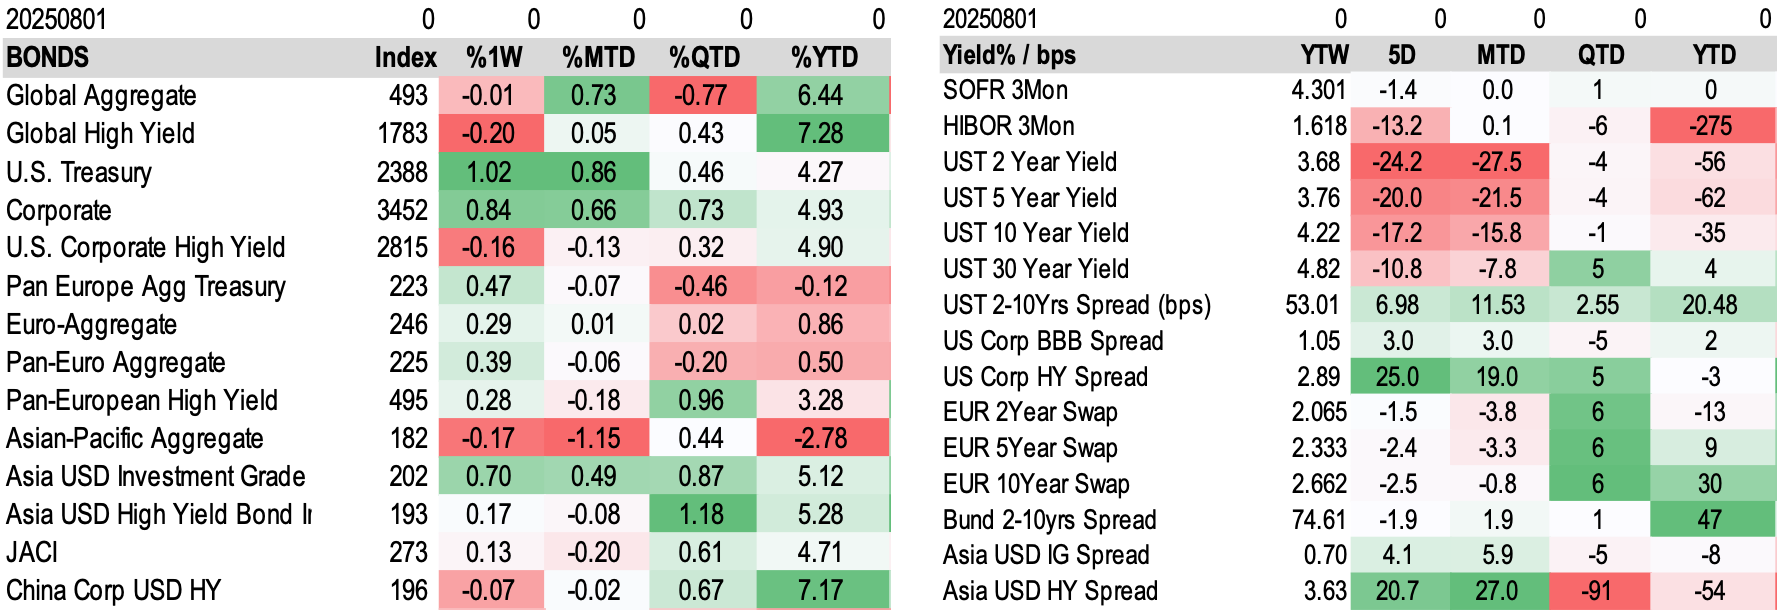
Fixed Income Performance
FactSet Updates
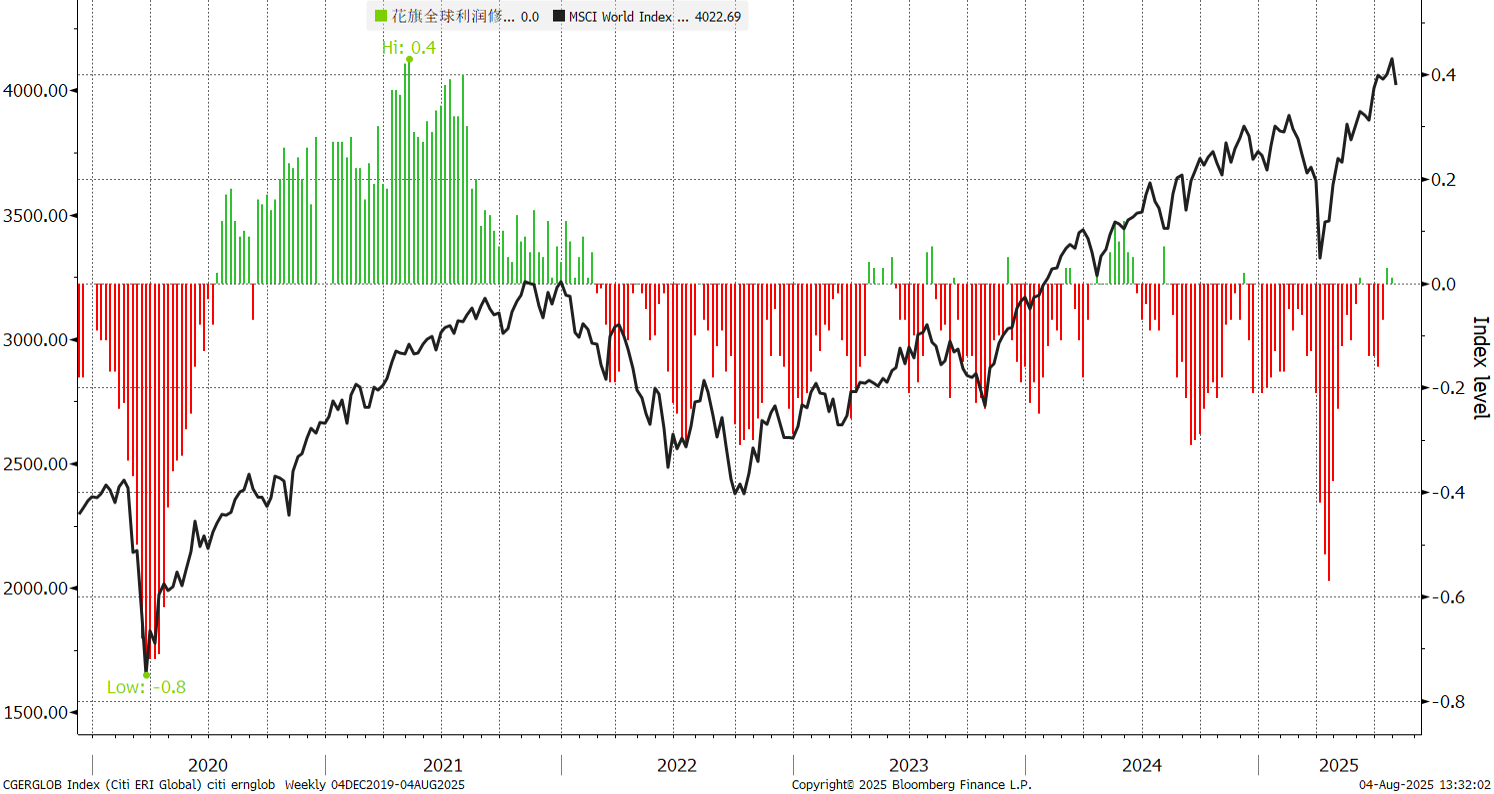
Earnings Revisions
S&P 500 Earnings & Revenue Consensus
Comparison of analyst consensus for S&P 500 year-over-year growth between this week and last week for Earnings and Revenue.
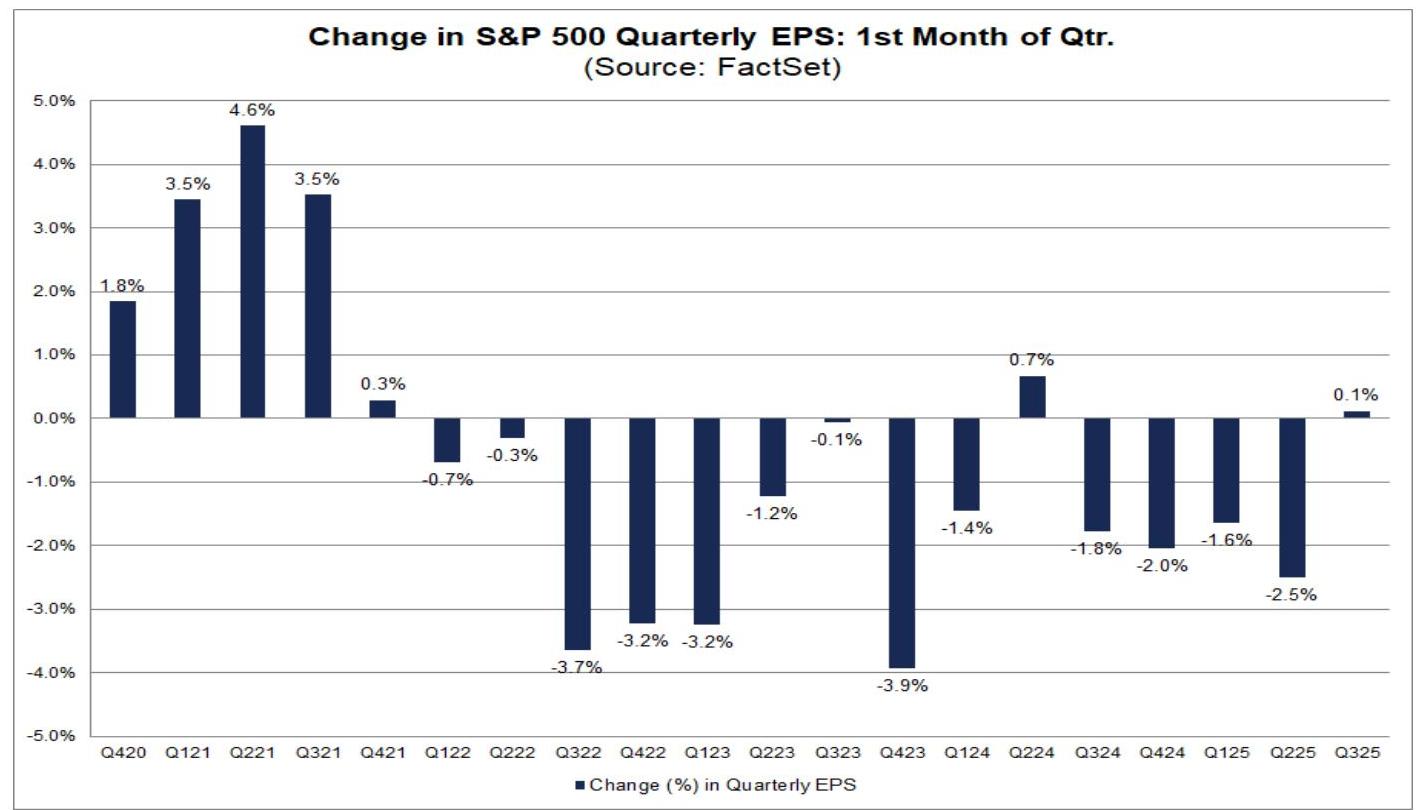
Analysts Upgraded Q3 S&P 500 EPS Expectation Slightly
- Despite market concerns about tariffs, analysts did not downgrade S&P 500 Q3 EPS expectations more than usual.
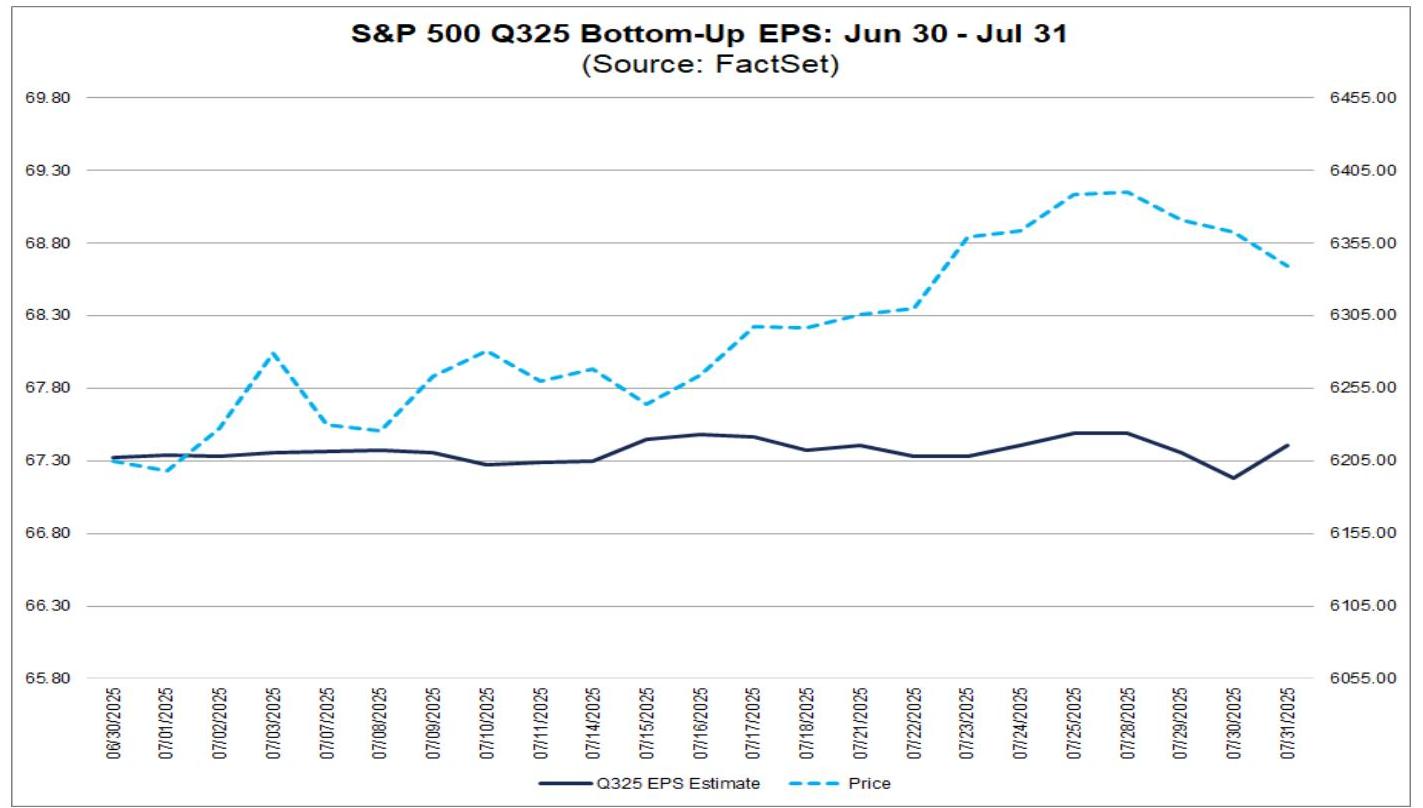
- In July, analysts slightly upgraded S&P 500 Q3 EPS expectations.
- Q3 bottom-up EPS estimate increased from $67.32 on June 30 to $67.40 on July 31, an increase of 0.1%.
- Historical Comparison: In a typical quarter, analysts usually lower earnings estimates in the first month of the quarter.
- Average decrease over the past 5 years (20 quarters) was 0.5%.
- Average decrease over the past 10 years (40 quarters) was 1.6%.
- Average decrease over the past 15 years (60 quarters) was 1.7%.
- Average decrease over the past 20 years (80 quarters) was 1.9%.
- Q3 2025 is the first time analysts have collectively raised EPS expectations in the first month of a quarter since Q2 2024 (+0.7%).
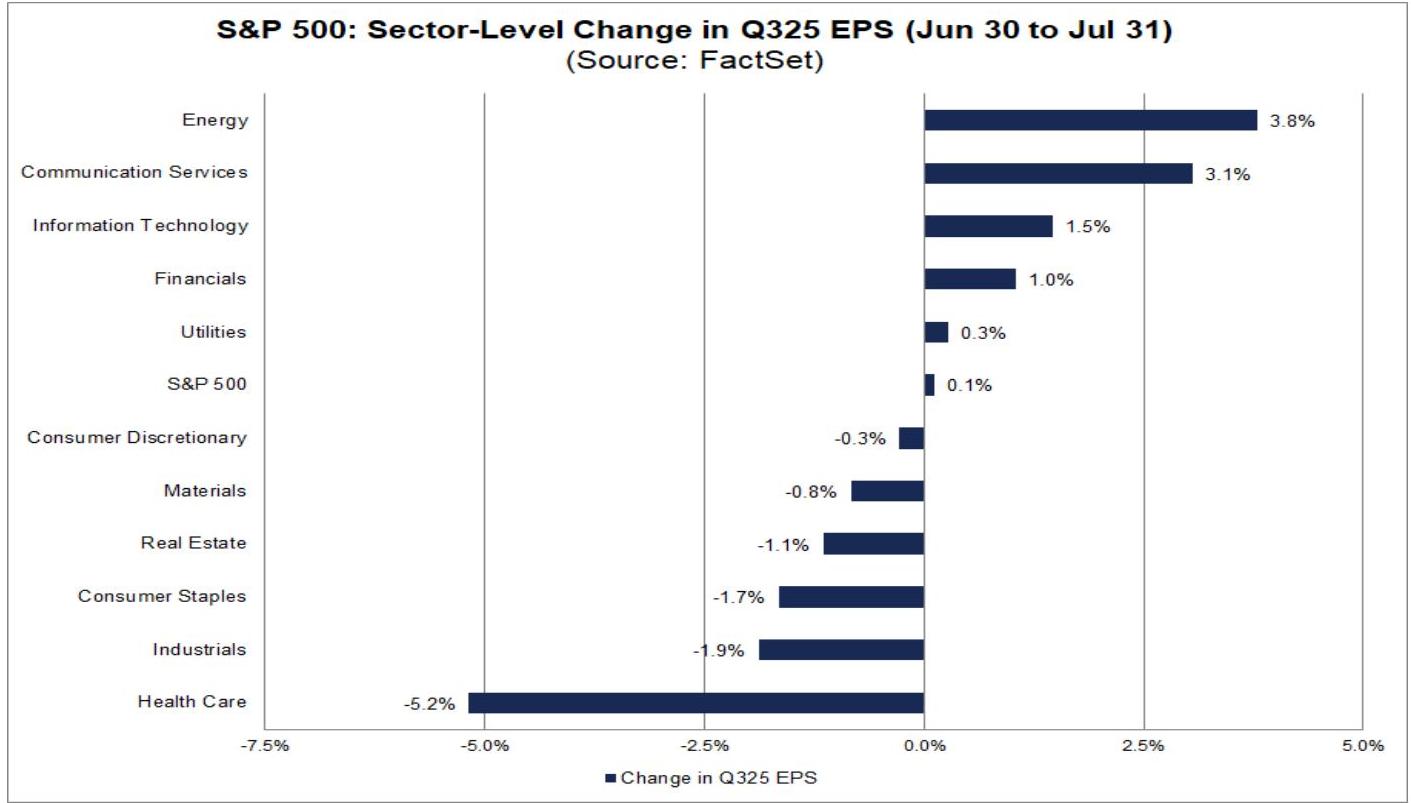
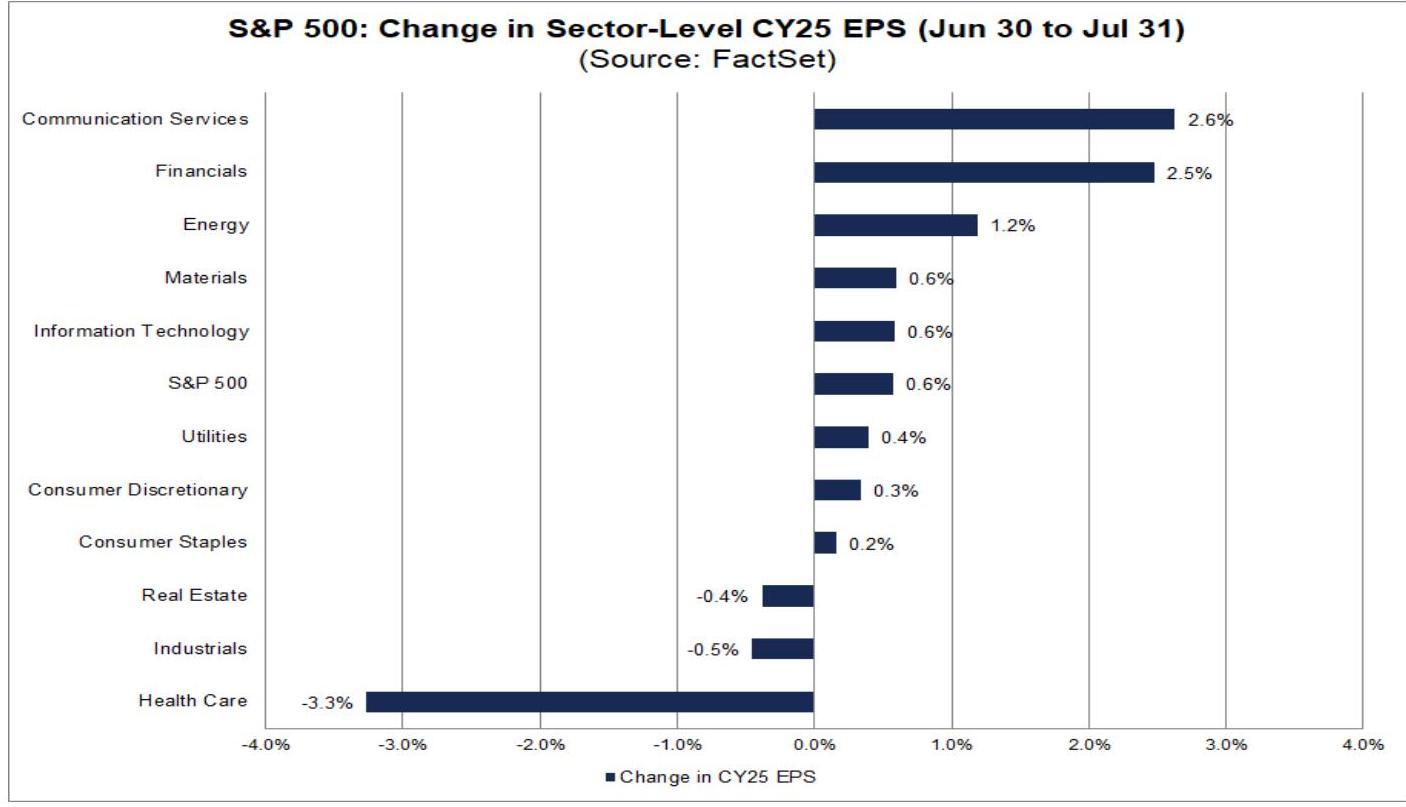
- Industry Level: 5 out of 11 industries saw Q3 2025 bottom-up EPS estimates upgraded between June 30 and July 31, led by Energy (+3.8%).
- Another 6 industries saw EPS estimates downgraded, with Health Care leading the decline (-5.2%).
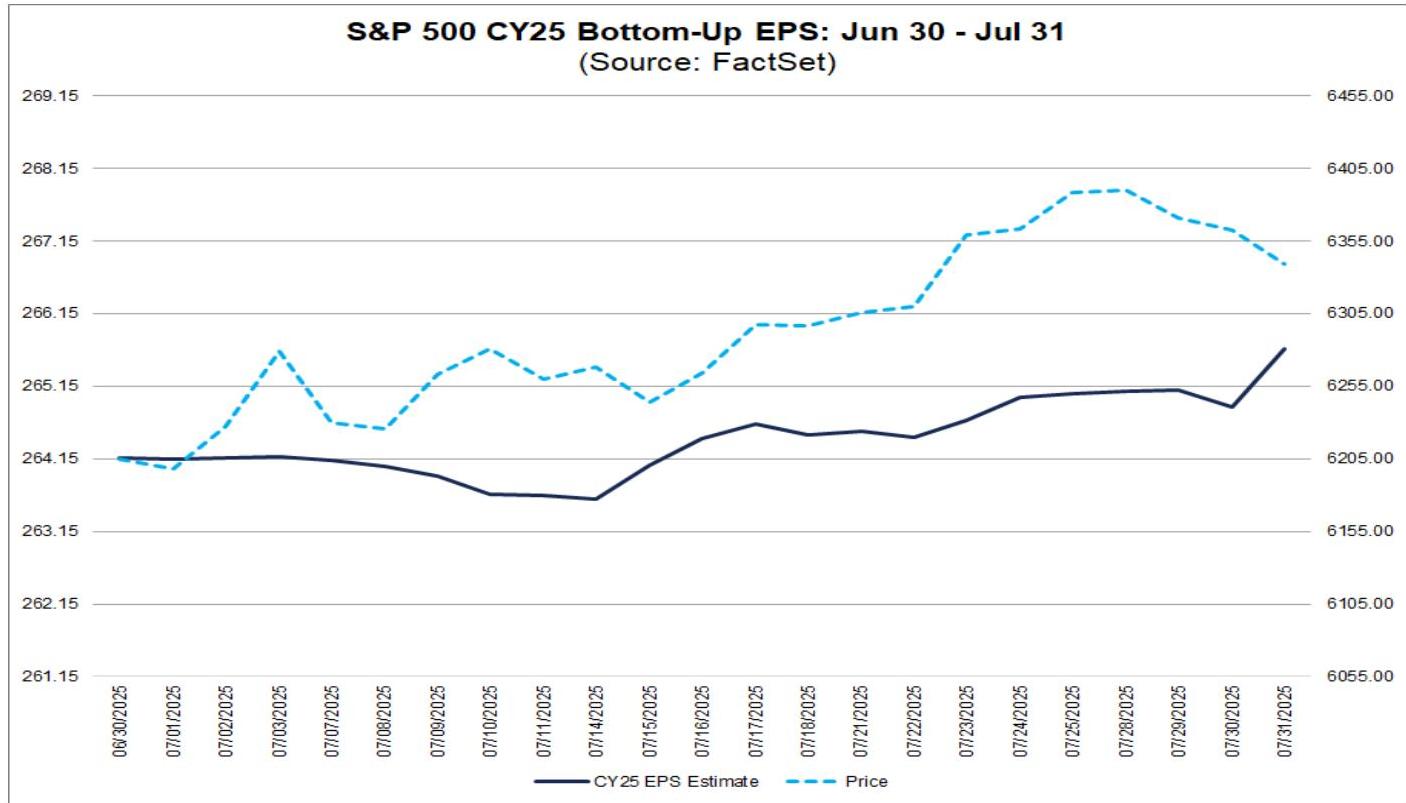
- Full-Year Expectation: Analysts also raised full-year earnings expectations.
- From June 30 to July 31, CY 2025 bottom-up EPS estimate increased from $264.17 to $265.66, an increase of 0.6%.
Market Punishes Negative EPS Surprises Severely
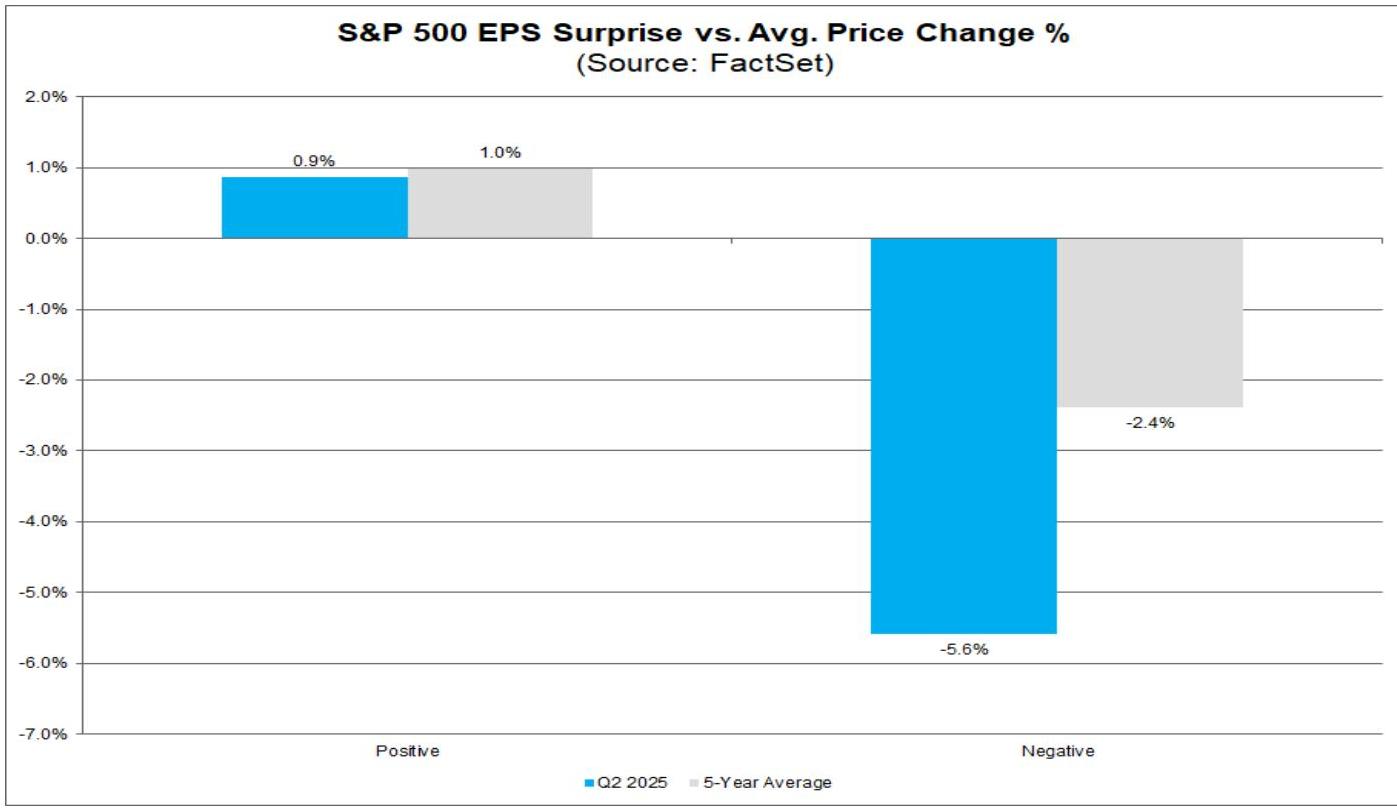
- Market reward for positive earnings surprises for Q2 2025 S&P 500 companies was slightly below average.
- Companies reporting positive earnings surprises saw an average stock price increase of 0.9% from two days before to two days after the earnings release.
- This gain was slightly below the 5-year average (1.0%).
- Market punishment for negative earnings surprises was significantly above average.
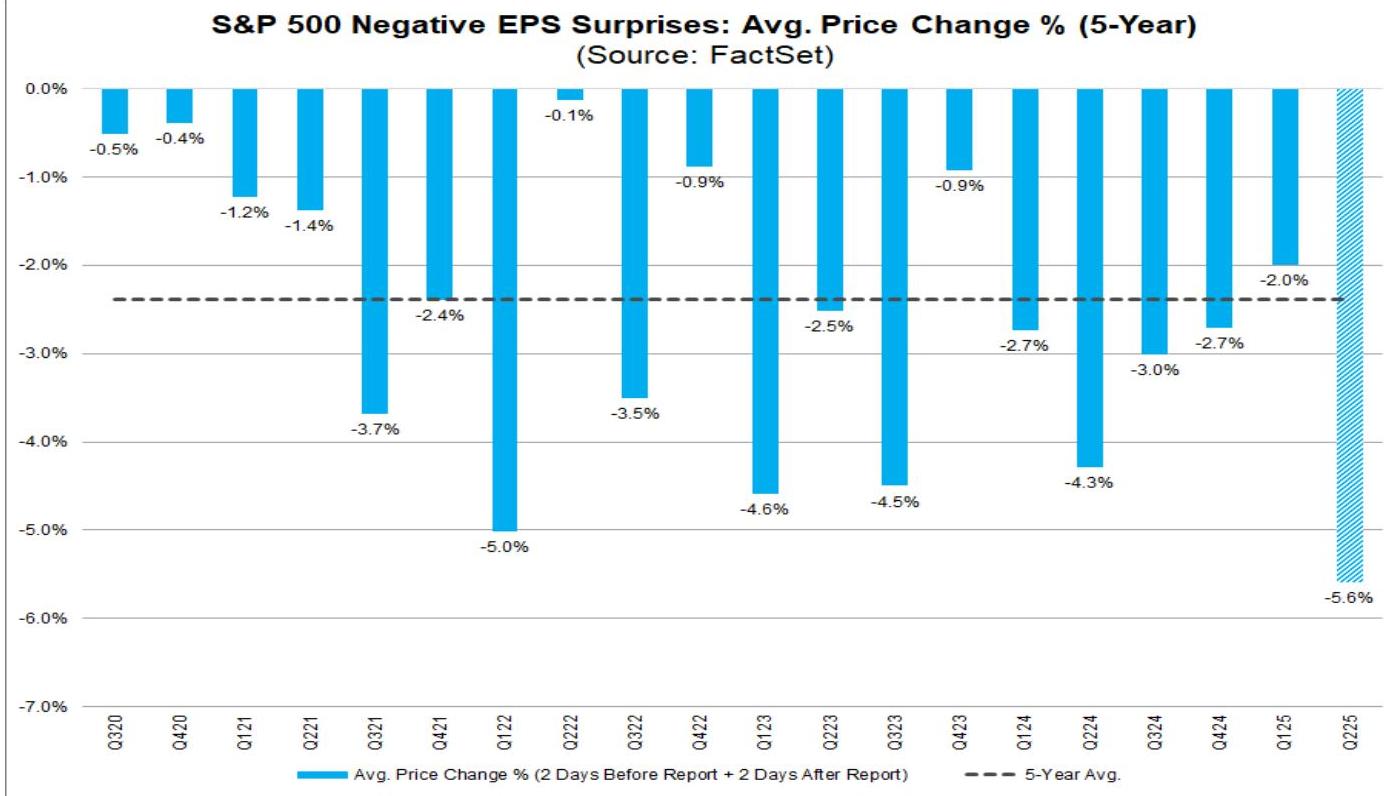
- Companies reporting negative earnings surprises saw an average stock price decrease of 5.6% from two days before to two days after the earnings release.
- This decline was significantly greater than the 5-year average (2.4%).
- Case of Negative EPS Surprise: Intel reported Q2 non-GAAP EPS of -$0.10 on July 24, below the average estimate of $0.01.
- From July 22 to July 28, Intel's stock price fell 11.0% (from $23.24 to $20.68).
- Reasons for severe market reaction to negative EPS surprises:
- Not due to deterioration in Q3 earnings outlook: Analysts slightly upgraded Q3 2025 EPS expectations in July (+0.1%).
- Proportion of negative EPS guidance is below average:
- As of now, 57 S&P 500 companies have issued Q3 2025 EPS guidance.
- Among them, 30 issued negative guidance, and 27 issued positive guidance.
- The proportion of companies with negative guidance is 53% (30 / 57), which is below the 5-year average (57%) and 10-year average (61%).
Valuation & Volatility
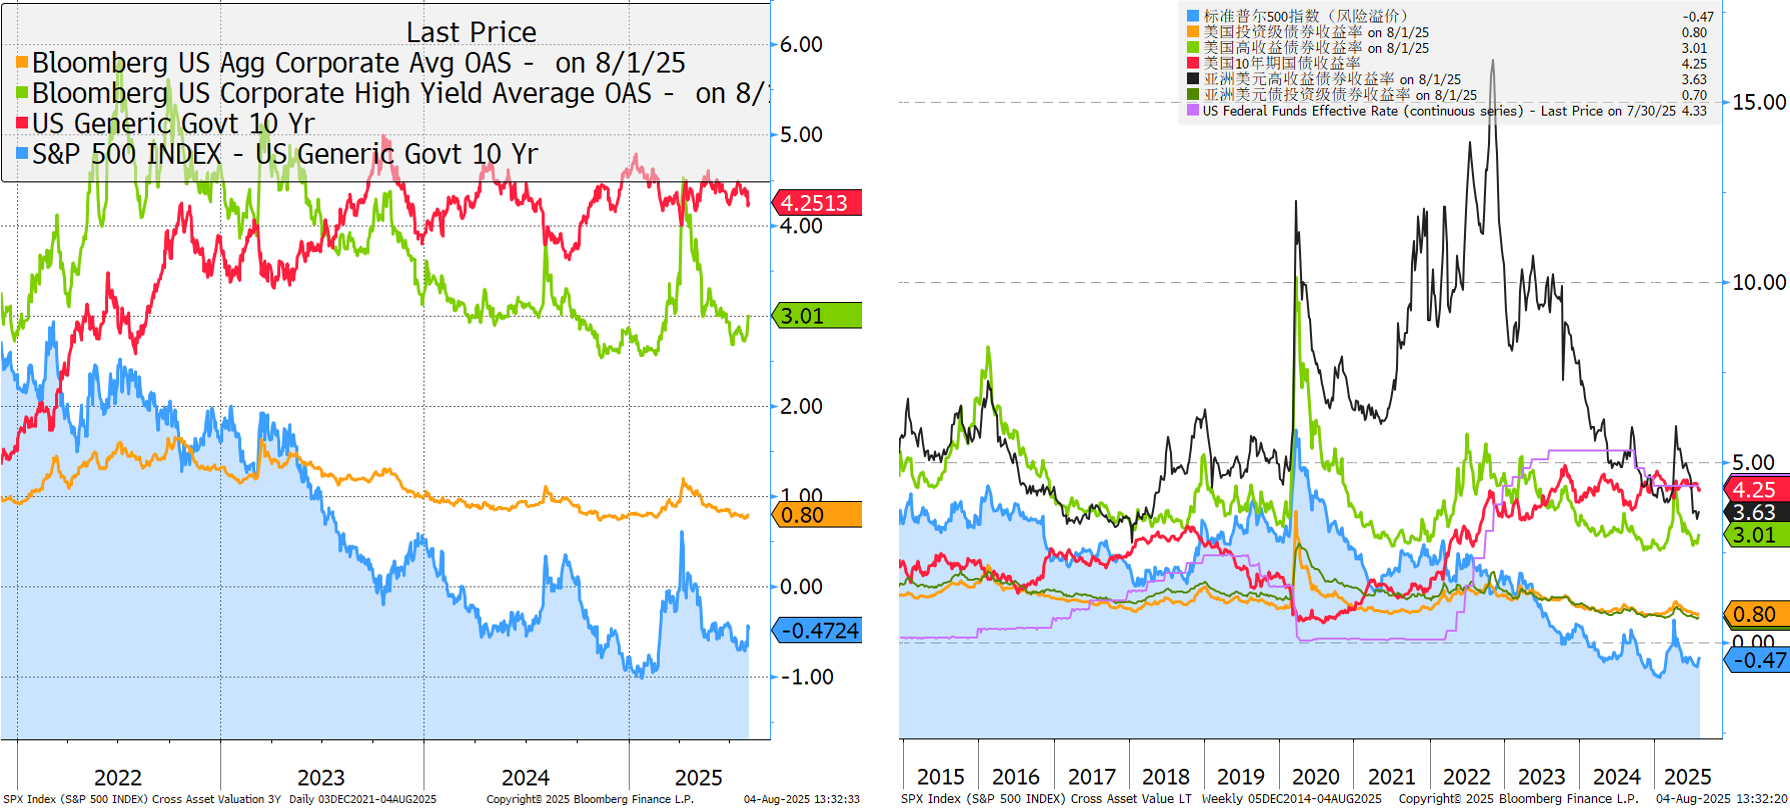
Cross Assets Valuation
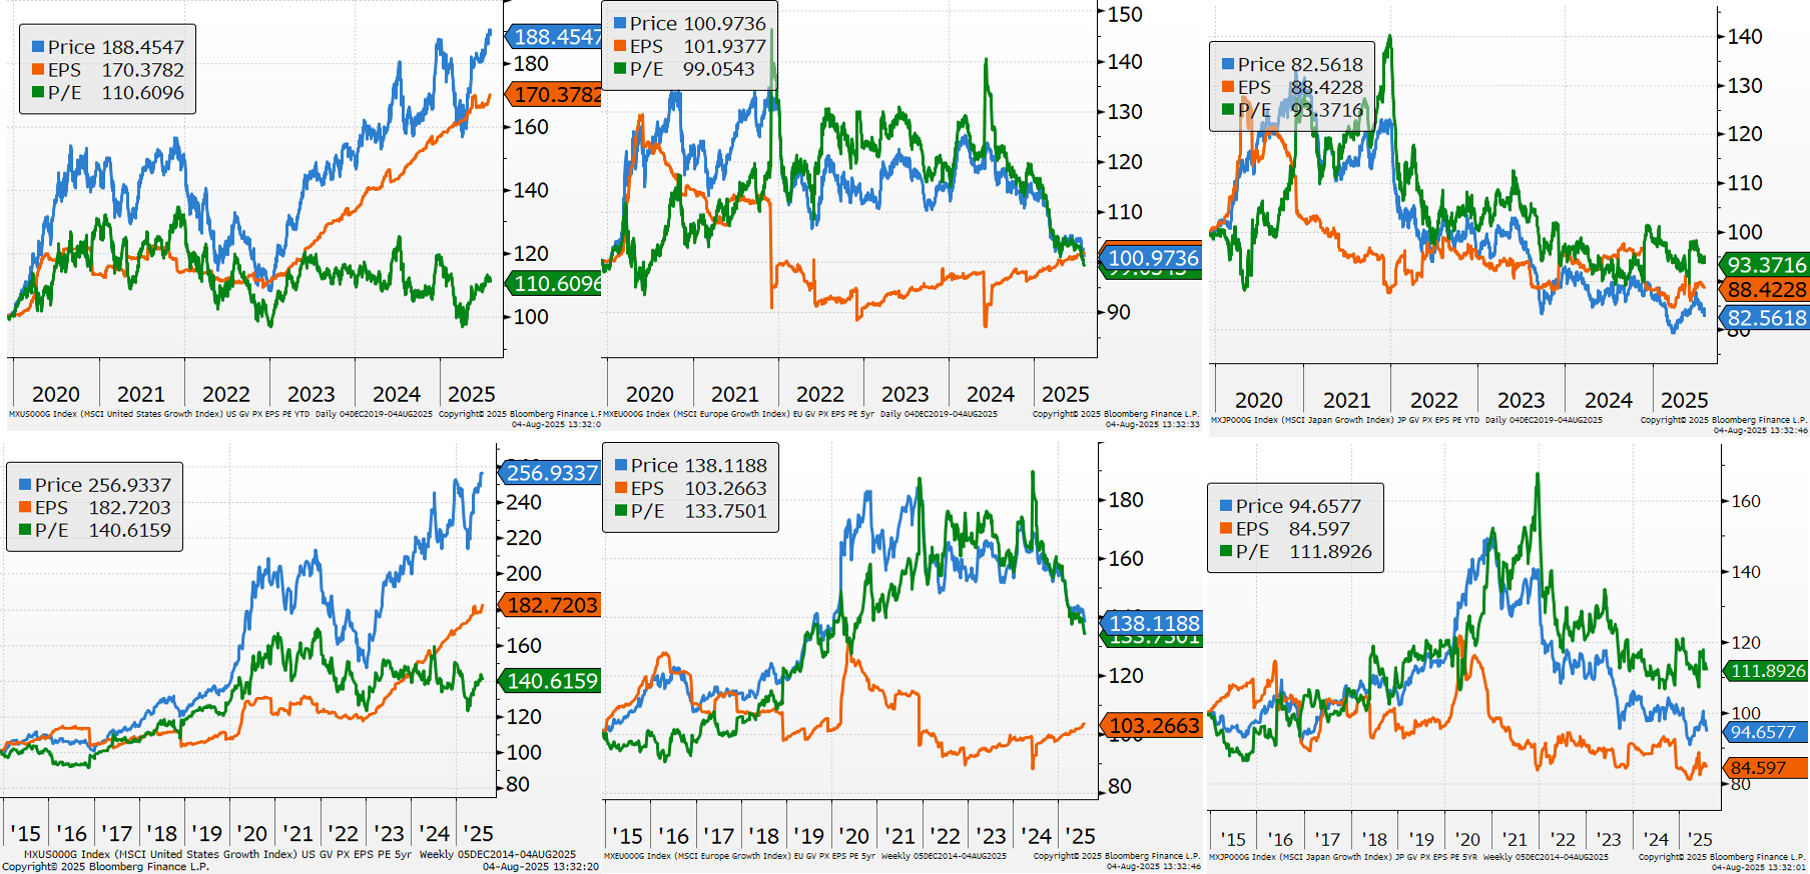
Style Relative Valuation
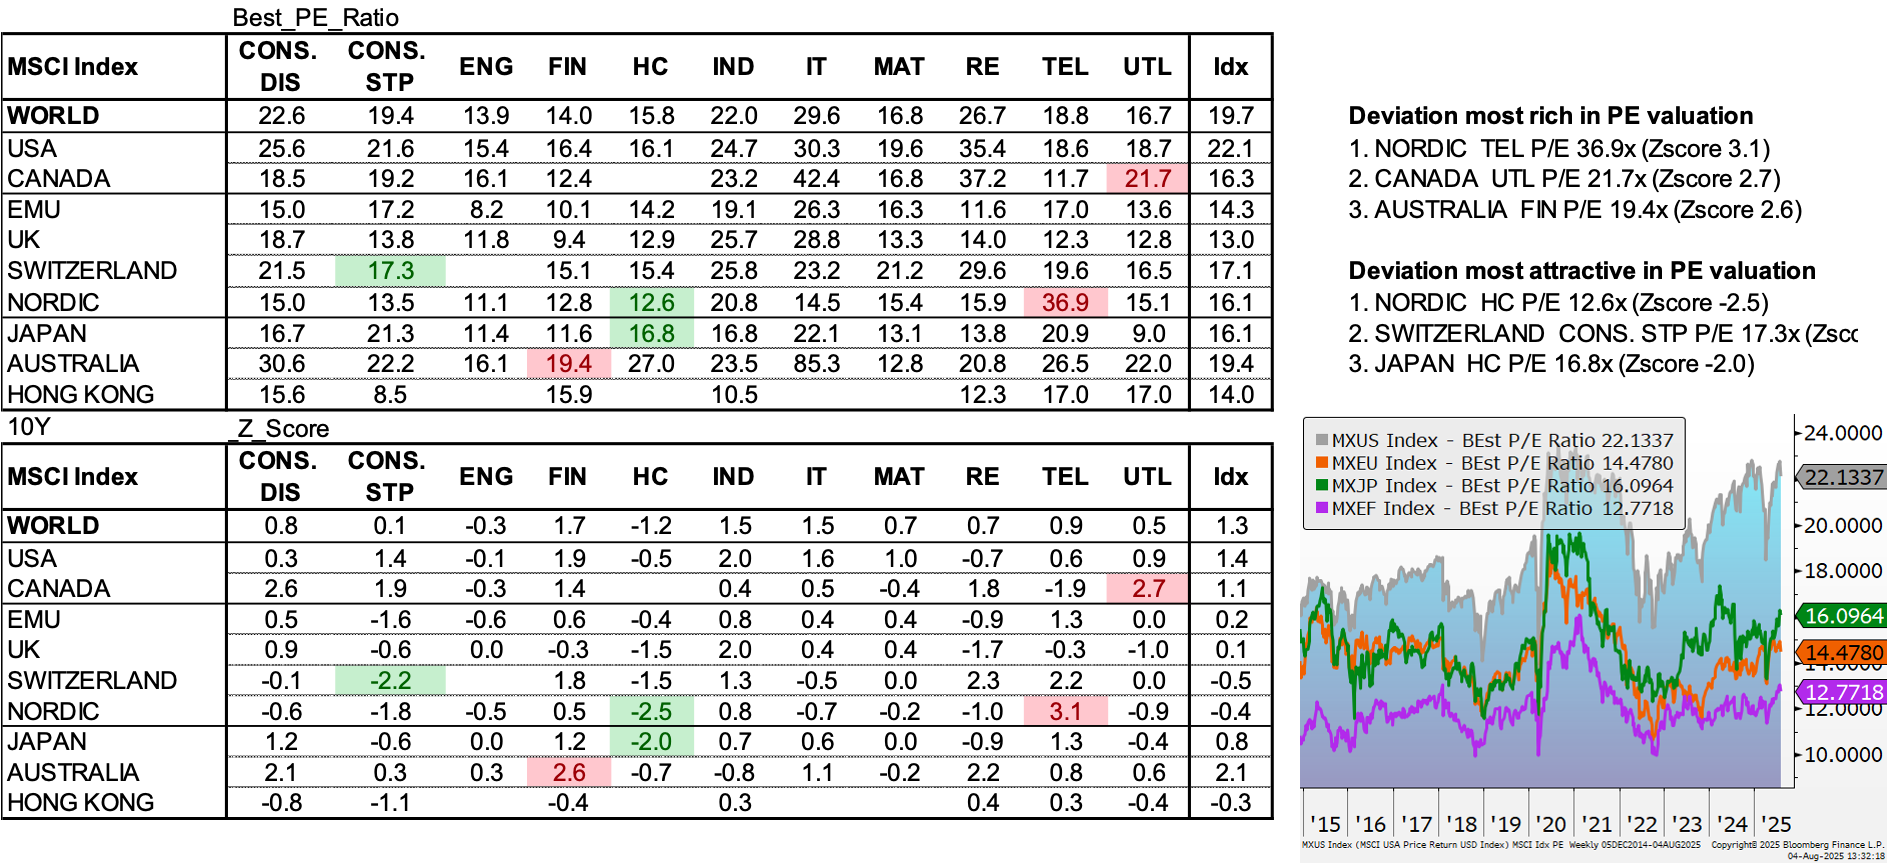
P/E Ratios
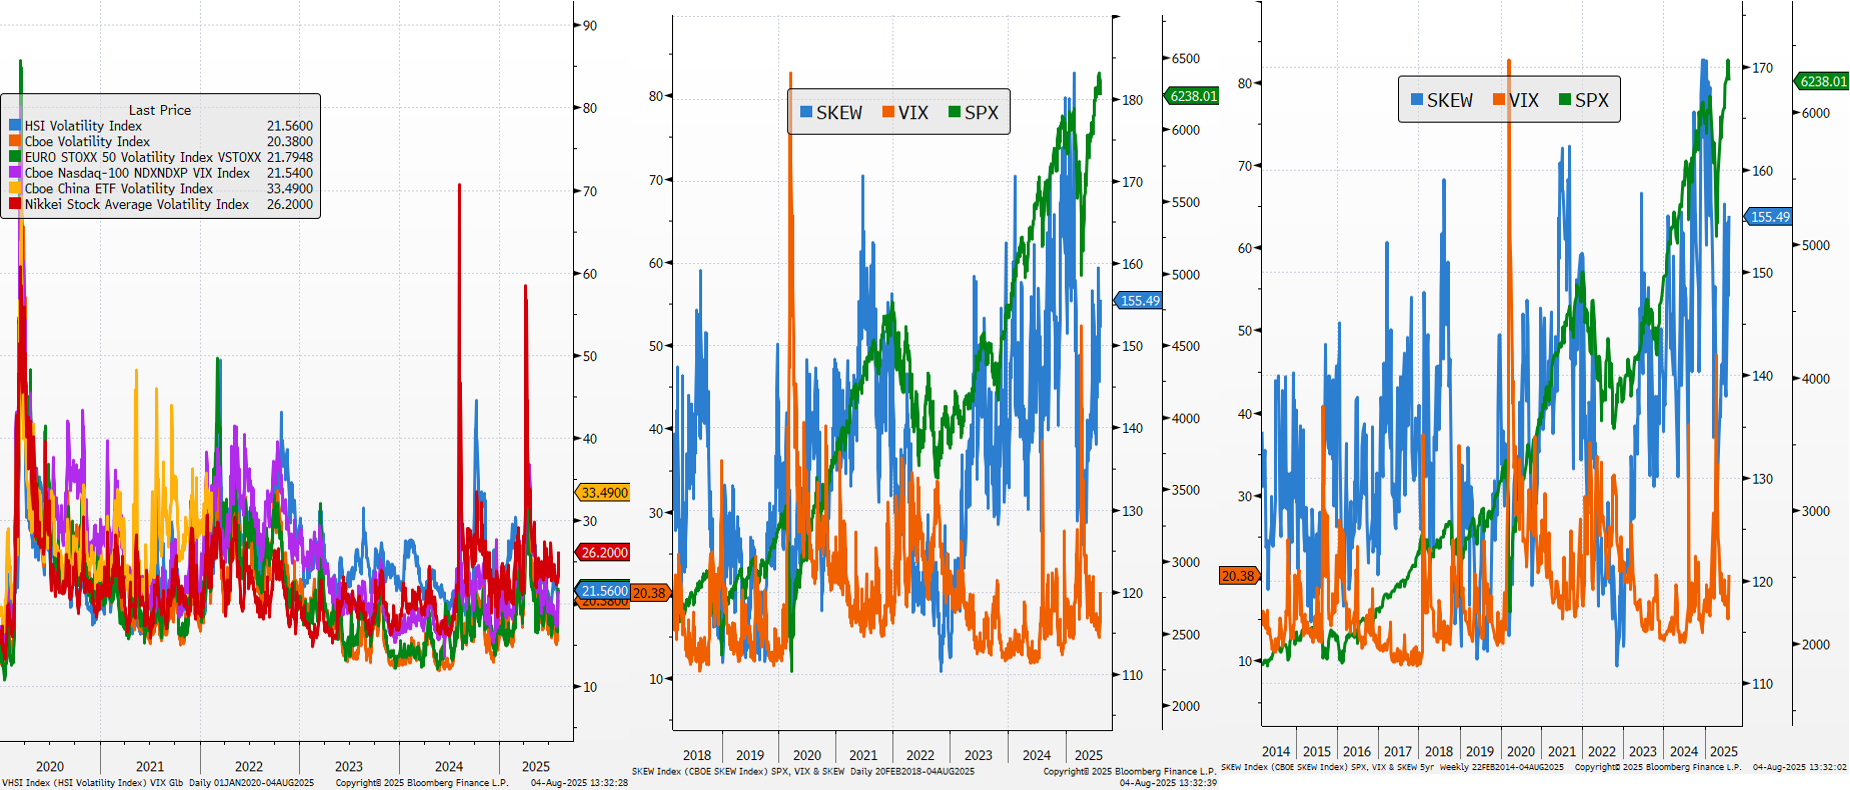
VIX and Skew
Intra Market Dynamics