×

Nintendo FY2025 Annual Report - Part I

Key Logic

Nintendo's performance in the 2025 fiscal year (ending March 31, 2025) was weak, with significant declines in total sales and various profit metrics. Operating profit, in particular, fell by 46.6% year-on-year, primarily due to the lack of powerful blockbuster games seen in the previous year. Despite the core Nintendo Switch platform entering its eighth year of operation, it maintained stable sales, and the next-generation console Nintendo Switch 2 was released on June 5, 2025, which is expected to provide new growth momentum for the company. To cope with increasing market competition and technological advancements, Nintendo adheres to its unique entertainment product strategy and actively expands the application of Nintendo IP beyond gaming platforms (such as visual content, mobile applications, and theme parks), while continuously investing in research and development. The company demonstrates clear policies and actions in sustainability and corporate governance, including a sound CSR system, diversified board composition, and transparent compensation policies, to maintain long-term corporate value and address various risks in global operations.

Company Overview

Major Financial Data and Trends

Consolidated Financial Data (FY2025 vs FY2024)

For the fiscal year ended March 31, 2025, Nintendo's total sales decreased by 30.3% to ¥1,164,922 million JPY (USD 7,818 million). Operating profit declined by 46.6% to ¥282,553 million JPY (USD 1,896 million).

Cash Flow Trends (FY2025 vs FY2024)

Operating cash flow significantly decreased from ¥462,097 million JPY last year to ¥12,069 million JPY (USD 81 million). Investment cash flow turned positive, reaching an inflow of ¥753,063 million JPY (USD 5,054 million), mainly due to withdrawals of time deposits and sale/redemption of securities.

Key Financial Ratios & Employee Metrics Overview

ROE (FY24 vs FY25)

20.15% 10.47%

Significant Decline

PER (FY24 vs FY25)

19.45x 42.22x

More Expensive Valuation

Total Employees (FY24 vs FY25)

7,724 8,205

Continued Growth

Net assets and total assets continued to grow. However, Net Income, Ordinary Income, and Profit attributable to owners of parent all saw significant declines, consistent with the operating profit trend. The increase in PER despite lower profitability might suggest market anticipation for future growth or other factors influencing valuation.

Company History

  1. Founding (November 1947)

    Originally established as Marufuku Co., Ltd., focusing on manufacturing and distributing Japanese (karuta) and Western playing cards.

  2. Renaming (October 1963)

    Company name changed to Nintendo Co., Ltd.

  3. Stock Exchange Listings (1962-2022)

    Listed on Osaka Securities Exchange and Kyoto Stock Exchange (Jan 1962), moved to Osaka Securities Exchange main board (Jul 1970), listed on Tokyo Stock Exchange main board (Jul 1983), and transferred to Prime Market (Apr 2022).

  4. Global Expansion (1980-2006)

    Established Nintendo of America Inc. in New York (Apr 1980), Nintendo of Europe GmbH in Germany (Feb 1990), and Nintendo of Korea Co., Ltd. in Korea (Jul 2006).

  5. Headquarters Relocation (November 2000)

    Final relocation to its current headquarters in Kyoto.

Business Description

Core Business & Products

  • Nintendo Co., Ltd. and its subsidiaries/affiliates (29 subsidiaries, 5 affiliates as of March 31, 2025) primarily develop, manufacture, and sell entertainment products.
  • Core products: computer-enhanced “Dedicated video game platforms” (hardware and software), character merchandise and playing cards.
  • IP Utilization: The company also engages in businesses leveraging IP, such as visual content and mobile applications.
  • Operates as a single business segment.

Key Participants & Functions

  • Development: Nintendo Co., Ltd., Nintendo Technology Development Inc., Nintendo Software Technology Corporation, Retro Studios, Inc., Next Level Games Inc., Shiver Entertainment, Inc., Nintendo European Research and Development SAS, iQue (China) Ltd., Nintendo Cube Co., Ltd., 1-UP Studio Inc., MONOLITH SOFTWARE INC., Mario Club Co., Ltd., SRD Co., Ltd., Nintendo Pictures Co., Ltd., Nintendo Systems Co., Ltd.
  • Manufacturing: Nintendo Co., Ltd.
  • Sales: Nintendo Co., Ltd., Nintendo of America Inc., Nintendo of Canada Ltd., Nintendo of Europe SE, Nintendo Australia Pty Limited, Nintendo of Korea Co., Ltd., Nintendo (Hong Kong) Limited, Nintendo of Taiwan Co., Ltd., Nintendo Sales Co., Ltd.

Subsidiaries and Affiliates

Major Consolidated Subsidiaries Financial Performance (FY2025)

Visualizing the sales and net profit/loss for key consolidated subsidiaries.

  • As of March 31, 2025, there are 29 consolidated subsidiaries.
  • Nintendo of America Inc. (US): Sales business, 100% Nintendo Co., Ltd. voting rights. Highest sales (¥462,202 million JPY / USD 3,102 million) and net profit (¥44,110 million JPY / USD 296 million).
  • Nintendo of Europe SE (Germany): Sales business, 100% Nintendo Co., Ltd. voting rights. Sales ¥272,893 million JPY (USD 1,831 million), but recorded a net loss of ¥4,101 million JPY (USD 27 million).

Consolidated Subsidiaries (Raw Data Images)

Click images to enlarge for original report data.

Major Consolidated Subsidiaries Financial Info 1

Major Consolidated Subsidiaries Financial Info (Part 1)

Major Consolidated Subsidiaries Financial Info 2

Major Consolidated Subsidiaries Financial Info (Part 2)

Affiliates Accounted for by the Equity Method

  • In addition to The Pokémon Company, there are 3 other affiliates accounted for by the equity method.
  • The Pokémon Company (Japan): Sales and licensing of Pokémon related goods business. Nintendo Co., Ltd. holds 32% ownership.
Affiliated Companies Info

Affiliated Companies Information

Employees

Group and Company Employee Details

  • Total Nintendo Group employees: 8,205 as of March 31, 2025.
  • Nintendo Co., Ltd. employees: 2,962. Average age: 40.2 years. Average years of service: 14.4 years. Average annual salary: ¥9,666,256 JPY (USD 64,874).
  • Labor Relations: No labor union within Nintendo Co., Ltd. Good labor relations across the group.

Gender Composition & Pay Gap (Nintendo Co., Ltd.)

The chart illustrates Nintendo Co., Ltd.'s female management ratio and overall male-female pay gap. The company attributes the pay gap primarily to differences in years of service and average age, not gender bias in remuneration or evaluation systems.

Company Gender Metrics 1

Company Gender Metrics (Raw Data 1)

Company Gender Metrics 2

Company Gender Metrics (Raw Data 2)

Business Overview

Management Policy, Environment, and Issues

Basic Management Policy

Nintendo aims to be an "entertainment company that creates smiles" by offering unprecedented entertainment experiences globally, while maintaining sound corporate management.

Target Management Indicators

Nintendo does not set specific management indicator targets due to inherent uncertainties in entertainment product and content development, allowing for decision-making flexibility in a highly competitive industry.

Management Environment & Mid-to-Long-term Strategy

  • Market Environment: Growing global entertainment demand, diversified entertainment forms due to technological advancements, and intensified competition in the gaming industry.
  • Core Strategy:
    • Focus on the Dedicated video game platform business (integrated hardware and software) to provide unique, intuitive entertainment.
    • Expand Nintendo IP audience through visual content, mobile apps, theme parks, and merchandise to drive interest in core gaming.
    • Maintain long-term consumer relationships via Nintendo Account, a key cross-platform connection.
    • New Product Release: Nintendo Switch 2 launched on June 5, 2025, aiming to build on the original Switch's success.
  • Core Philosophy: Entertainment's value lies in uniqueness; Nintendo aims for sustainable growth by valuing creativity and adapting to change.

Sustainability Methodology and Initiatives

CSR Objectives & Governance

  • Goal: "Bringing smiles to everyone touched by Nintendo," advancing comprehensive CSR activities.
  • Four Priority Areas: Consumers, Supply Chain, Employees, Environment.

CSR Governance Structure (Click image to enlarge).

CSR Activity Governance Structure

CSR Governance Structure

CSR Priority Area Initiatives

  • Consumers: Quality and safety assurance, child-friendly game development (parental control features, inappropriate content filtering).
  • Supply Chain: Partner collaboration, CSR procurement guidelines ensuring legal, social, human rights, and environmental compliance.
  • Employees: Talent development based on "Nintendo DNA" (originality, flexibility, sincerity), promoting diversity, optimizing work environment (support systems, childcare leave).
  • Environment: Reducing environmental footprint from design to recycling, efficient transportation, climate change assessment based on TCFD.
  • CSR Risk Management: Identified and prioritized with overseas CSR teams, regular assessments.

CSR Metrics and Targets: Parental Leave Utilization

The chart illustrates Nintendo's outstanding performance in parental leave utilization. Female employee childcare leave utilization rate maintained at 105% (exceeding 100% target) and male employee utilization rate reached 81% (exceeding 50% target) for the cumulative 5-year period starting FY2022. Percentages over 100% are due to calculation based on "number of employees who started leave" vs. "number of births in the same year."

Risk Factors

Economic Environment Risks

  • Foreign Exchange Rate Fluctuations: Over 70% of sales are outside Japan, largely in local currencies. Fluctuations can negatively impact financial status, operating results, and cash flow. Mitigated by continuous foreign currency procurement.

Business Activity Risks

  • Market Volatility & Competition: Intense competition, changing consumer preferences, new entrants. Nintendo counters with unique hardware/software and expanding Nintendo IP touchpoints.
  • New Product Development: High cost, long cycles, uncertain consumer preferences. Efforts made to develop unique and attractive products.
  • Product Valuation & Inventory: Short product life cycles, seasonal impact, inaccurate demand forecasts. Managed by forecasting production and downloadable software.
  • Reliance on External Manufacturers: Risks include supplier bankruptcy, supply shortages, cost increases, quality issues. Mitigated by multi-sourcing components and outsourcing production.
  • Seasonal Fluctuations: Sales concentrated in year-end/New Year. Addressed by developing long-playable games and digital services.
  • System Issues: Online services face cyberattacks, system disruptions, data breaches. Strengthened by internal resources and external experts.
  • Other Factors: Geopolitical issues, tax system inconsistencies, talent recruitment, labor disputes, natural disasters, etc.

Legal & Litigation Risks

  • Product Liability: Defects may lead to recalls or compensation, impacting reputation and financials.
  • IP Enforcement Limitations: Difficulty combating unauthorized uploads and counterfeits in some regions.
  • Unauthorized Access & Data Leakage: Risk of personal/confidential information exposure.
  • Regulatory Changes: Unexpected changes in laws, accounting standards, or tax systems.
  • Litigation: Global operations may face various lawsuits.

Other Risks

  • Unrecoverable receivables, financial institution failures, environmental regulations, brand damage, political changes, climate change, natural disasters, pandemics.

Management Analysis of Financials & Operations

Nintendo Switch Sales Performance (FY2025 vs FY2024)

The chart illustrates the year-over-year decline in Nintendo Switch hardware and software sales, primarily due to the strong performance driven by blockbuster games in the previous fiscal year.

Best-Selling Games in FY2025 (Units Sold)

This chart highlights the top-selling Nintendo-published titles released or significantly contributing in FY2025. Mario Kart 8 Deluxe continues to be a strong performer with a high cumulative sales figure.

  • Digital sales: ¥32.6 billion JPY (USD 2,187 million), down 26.5%.
  • Mobile & IP Related Business: Sales down 27.0% to ¥6.76 billion JPY (USD 453 million).
  • Sales outside Japan: ¥890.0 billion JPY (USD 5,973 million), down 32.0%, representing 76.4% of total sales.

Financial Position Analysis (FY2025)

  • Total Assets: Increased by ¥247.1 billion JPY (USD 1,658 million) to ¥3,398.5 billion JPY (USD 22,808 million), driven by increases in cash & deposits and inventories.
  • Total Liabilities: Increased by ¥126.6 billion JPY (USD 849 million) to ¥673.0 billion JPY (USD 4,516 million), mainly due to increased notes and accounts payable.
  • Net Assets: Increased by ¥120.4 billion JPY (USD 808 million) to ¥2,725.4 billion JPY (USD 18,291 million), mainly due to increased retained earnings.

Cash Flow Analysis (FY2025)

  • Cash and cash equivalents balance: ¥1,414.1 billion JPY (USD 9,490 million), increased by ¥560.6 billion JPY (USD 3,762 million) this fiscal year.
  • Operating Activities Cash Flow: Increased by ¥12.0 billion JPY (USD 80 million).
  • Investing Activities Cash Flow: Increased by ¥753.0 billion JPY (USD 5,053 million).
  • Financing Activities Cash Flow: Decreased by ¥195.1 billion JPY (USD 1,309 million).

Production, Order Receiving, and Sales Information

Production Performance Overview (FY2025 vs FY2024)

This chart compares the production value of Dedicated video game platforms and other products between fiscal years 2024 and 2025, showing overall growth driven by game platforms despite a decline in other product categories.

Production Performance Overview

Production Performance Overview (Raw Data Image)

Sales Performance (FY2025)

  • Dedicated video game platform sales: ¥1,083,534 million JPY (USD 7,272 million), down 30.9% YoY. Nintendo Switch platform sales were ¥1,050,296 million JPY (USD 7,048 million), down 31.5% YoY.
  • Mobile, IP-related revenue: ¥67,673 million JPY (USD 454 million), down 27.0% YoY.
  • Total sales: ¥1,164,922 million JPY (USD 7,818 million), down 30.3% YoY.

Factors Significantly Impacting Operating Results

  • Core Business Impact: Blockbuster product emergence and sales significantly impact performance. Popularity of other non-gaming entertainment forms also affects.
  • Exchange Rate Fluctuations: Over 70% of sales are outside Japan, primarily in local currencies. Hedging measures are in place, but cannot fully eliminate impact.
  • Product Portfolio Profit Differences: Dedicated video game platforms and compatible software are main products, but hardware and software have different profit margins. Their proportion in total sales affects gross profit and margin.

Research and Development Activities

R&D Focus & Activities

  • Mainly dedicated to hardware and software development for Dedicated video game systems, and expanding planning, development, and operation of amiibo, visual content, and smart device applications.
  • Hardware R&D: Continuous research into underlying technologies (semiconductors, LCDs, electronics), exploring applicability of touch panels, sensors, wireless comms, security, cloud, VR/AR/MR, deep learning, big data. Focus on durability, safety, quality, performance, accessories, cost reduction.
  • Software R&D: Product planning leveraging hardware features, focusing on game design (graphics, music, scripts), pushing system infrastructure for network services (Nintendo eShop), establishing smart device software R&D architecture.
  • Production & Procurement: Promoting new testing methods/technologies for mass production of components, collaborating with manufacturing partners on legal/regulatory research.
  • R&D Expenses (FY2025): $143.7 billion JPY (USD 964 million).

Major R&D Achievements (FY2025)

  • New Console Release: Nintendo Switch 2 launched on June 5, 2025, with larger, more responsive screen, new magnetic Joy-Con 2, stronger processing/graphics.
  • New Console Launch Titles: Mario Kart World and Nintendo Switch 2 Welcome Tour.
  • Remastered Older Games: The Legend of Zelda: Breath of the Wild - Nintendo Switch 2 Edition and The Legend of Zelda: Tears of the Kingdom - Nintendo Switch 2 Edition.
  • Nintendo Switch Firmware & Services: Firmware updates for convenience/stability, special edition systems, continuous improvement of software dev environment and network services.
  • Nintendo Switch Compatible Software: Released titles like The Legend of Zelda: Echoes of Wisdom (first Princess Zelda protagonist), Nintendo World Championships: NES Edition (online NES game competition), Endless Ocean Luminous, Emio - The Smiling Man: Famicom Detective Club, Super Mario Party Jamboree, Mario & Luigi: Brothership, Paper Mario: The Thousand-Year Door (HD remaster), Luigi's Mansion 2 HD, Donkey Kong Country Returns HD, Xenoblade Chronicles X: Definitive Edition (HD remaster).
  • Mobile Business: Continued operation of Fire Emblem Heroes, Pikmin Bloom, and Mario Kart Tour.
  • Nintendo Switch Online: Added more titles to Nintendo Entertainment System - Nintendo Classics, Super Nintendo Entertainment System - Nintendo Classics, etc., with continuous improvements.
  • Other New Products: Nintendo Sound Clock: Alarmo, a unique alarm clock with a motion sensor.
  • Developer Support: Continuous support for game creators via Nintendo Developer Portal.

Equipment and Facilities

Capital Investment Overview (FY2025)

FY2025 Capital Investment Breakdown

In FY2025, total capital investment reached $39,275 million JPY (USD 263 million), primarily for R&D facilities, including intangible assets like internal computer software. All capital investments were internally financed.

Main Facilities

Major Facilities Book Value & Employees (Nintendo Co., Ltd.)

  • Corporate Headquarters (Kyoto): Highest book value (¥54,772 million JPY / USD 367 million), most employees (2,647), involves management, sales, development and manufacturing.
  • Uji Plant (Kyoto): Main production facility, book value ¥4,338 million JPY (USD 29 million), 141 employees.
  • Nintendo Museum (Kyoto): Book value ¥9,243 million JPY (USD 62 million), listed as "other facilities".
  • Tokyo Branch Office: Rented office, annual rent ¥1,486 million JPY (USD 9 million).
Company Main Facilities JPY

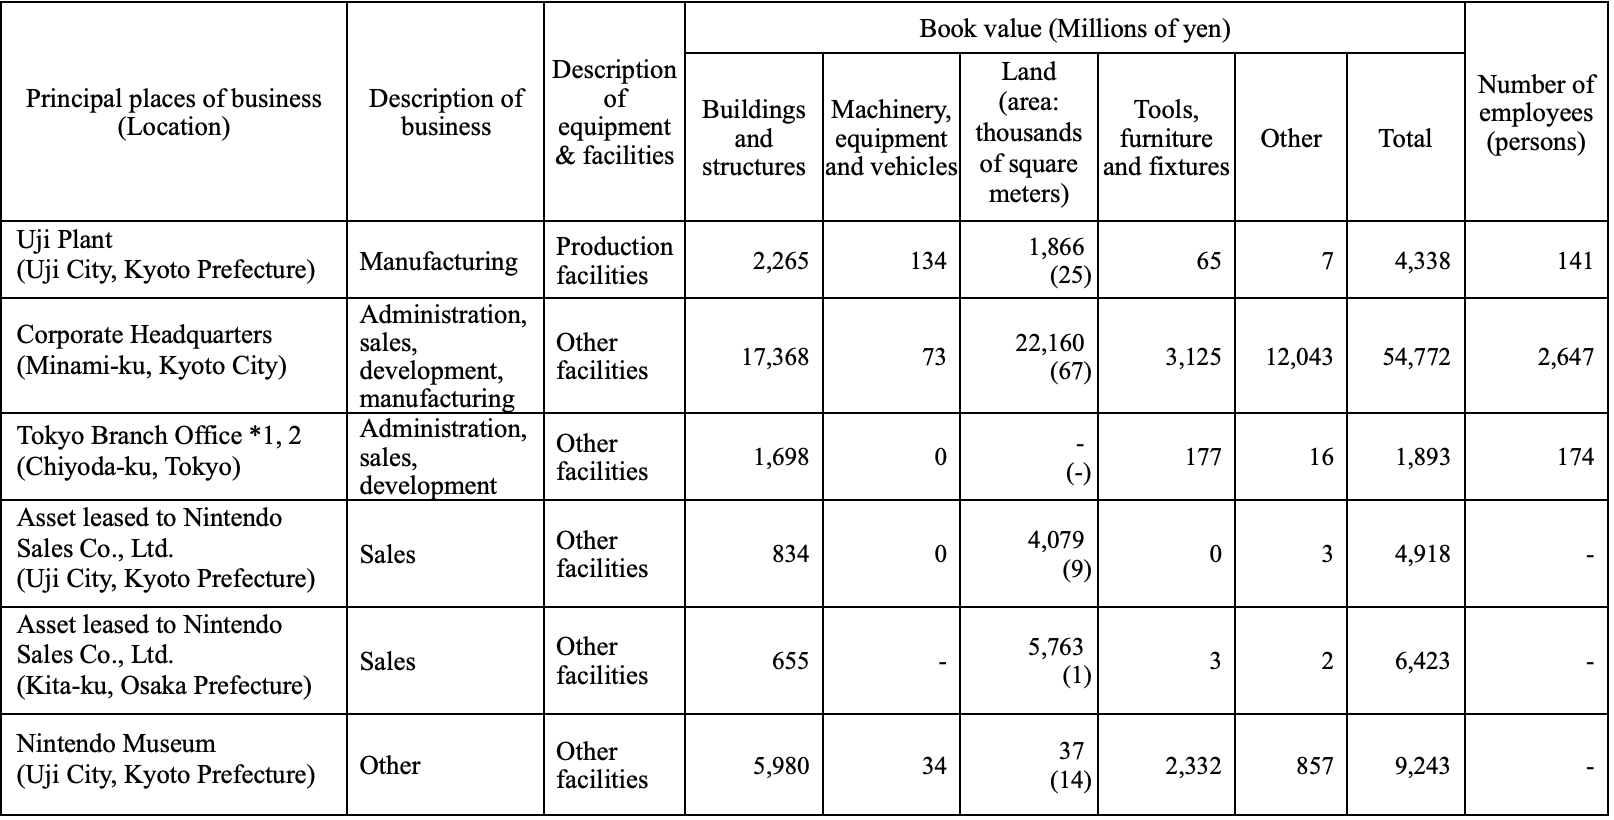
Main Facilities (JPY, Raw Data)

Company Main Facilities USD

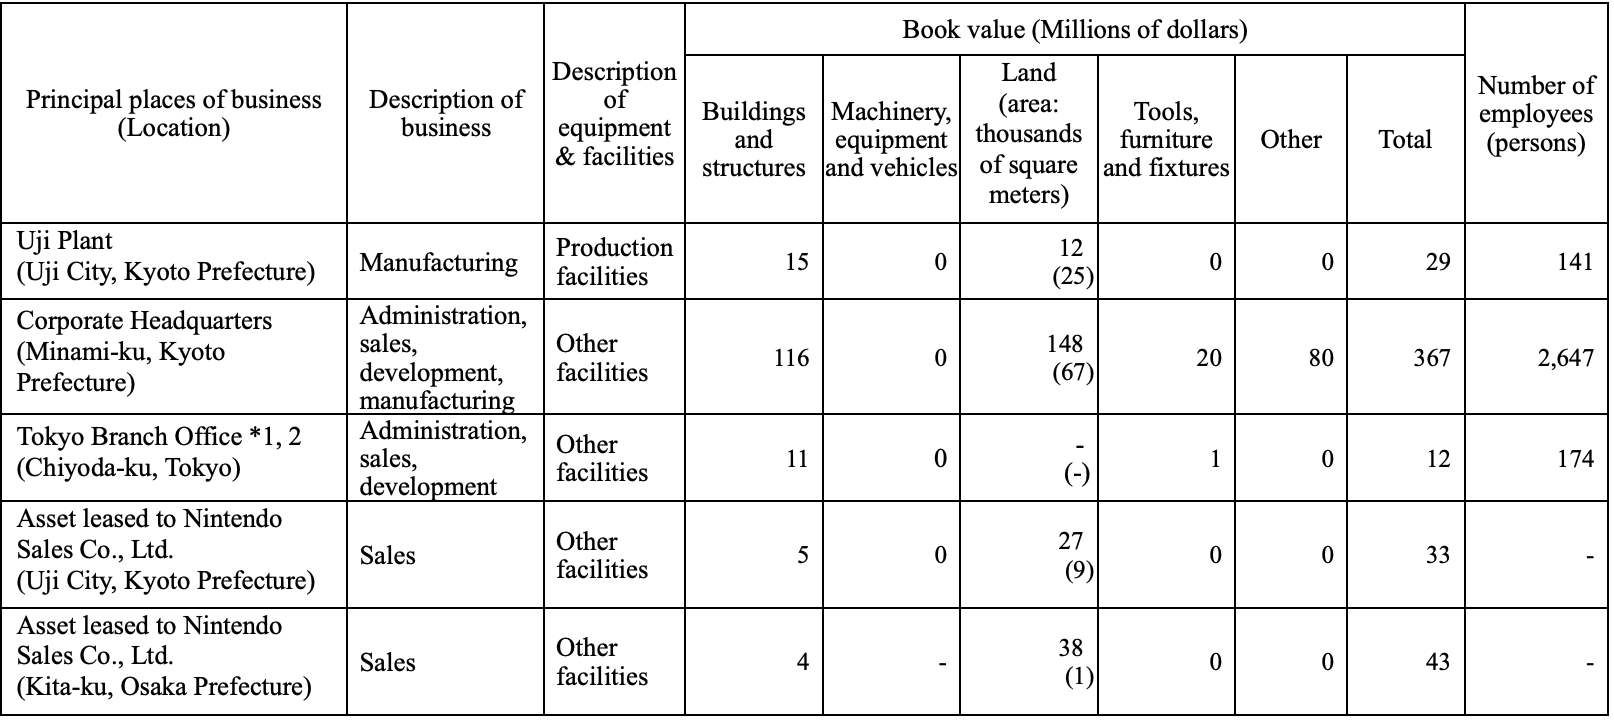
Main Facilities (USD, Raw Data)

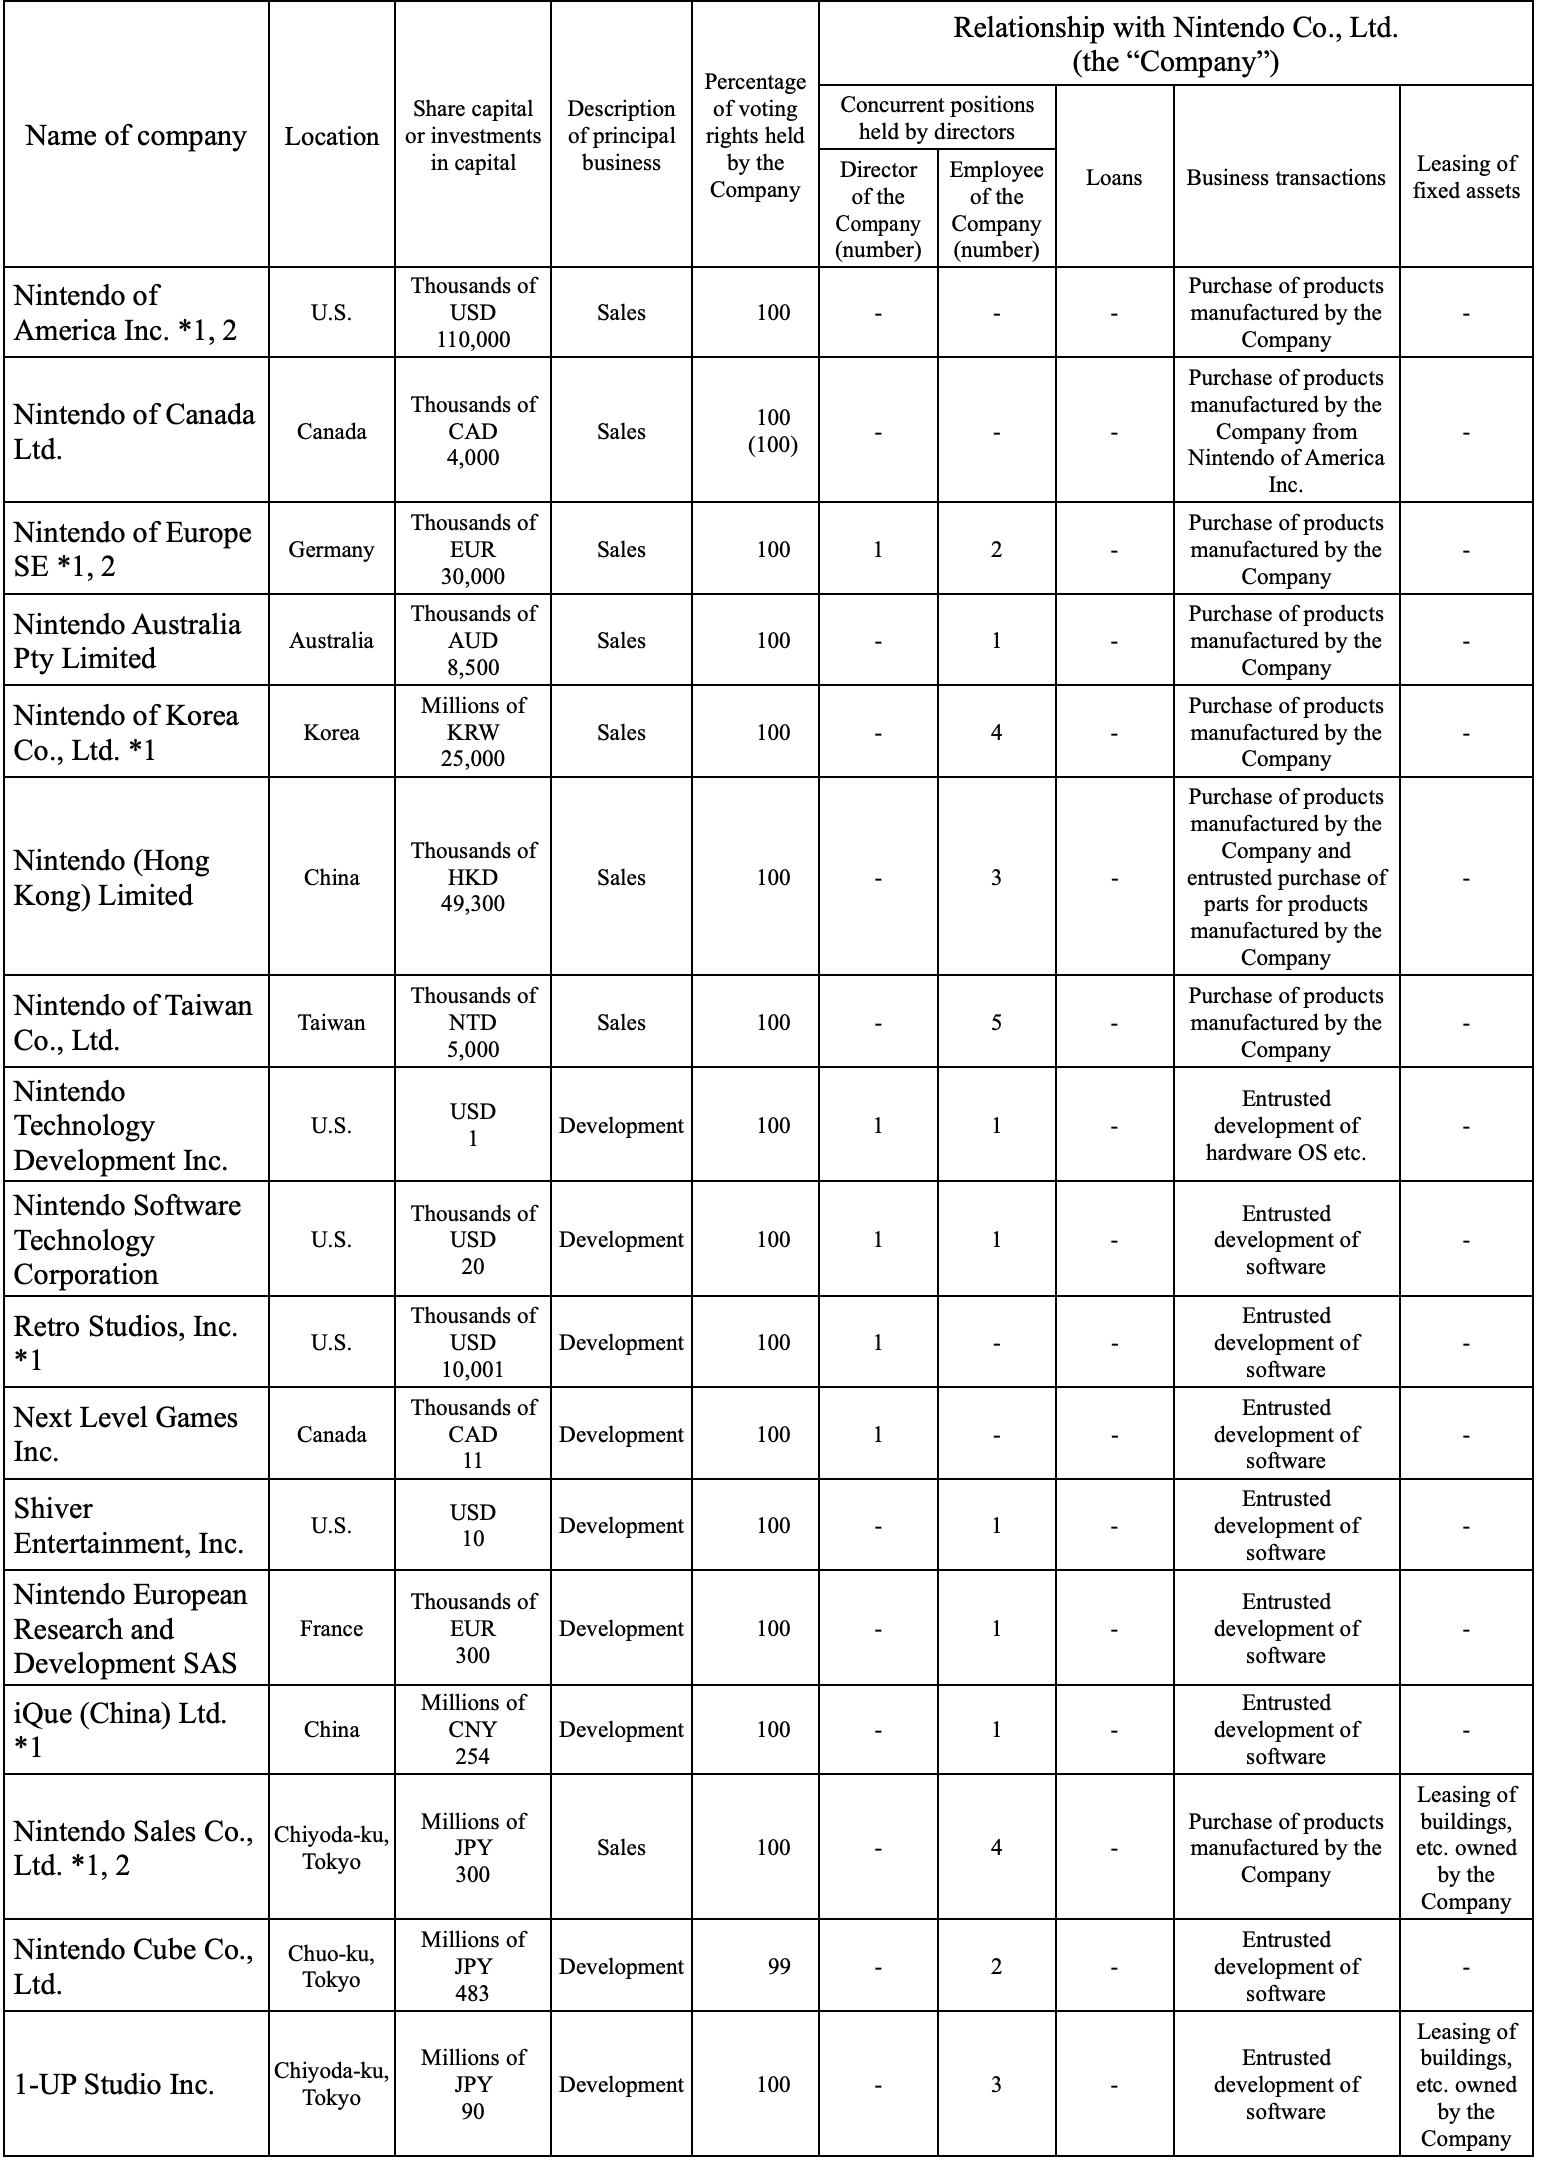
Overseas Subsidiary Main Facilities (Book Value)

  • Nintendo of America Inc. (US): Total book value ¥22,505 million JPY (USD 151 million), highest among overseas subsidiaries.
  • Nintendo of Europe SE (Germany): Total book value ¥7,665 million JPY (USD 51 million).
  • Significant investment in facilities by two major overseas sales subsidiaries.
Overseas Subsidiaries Main Facilities

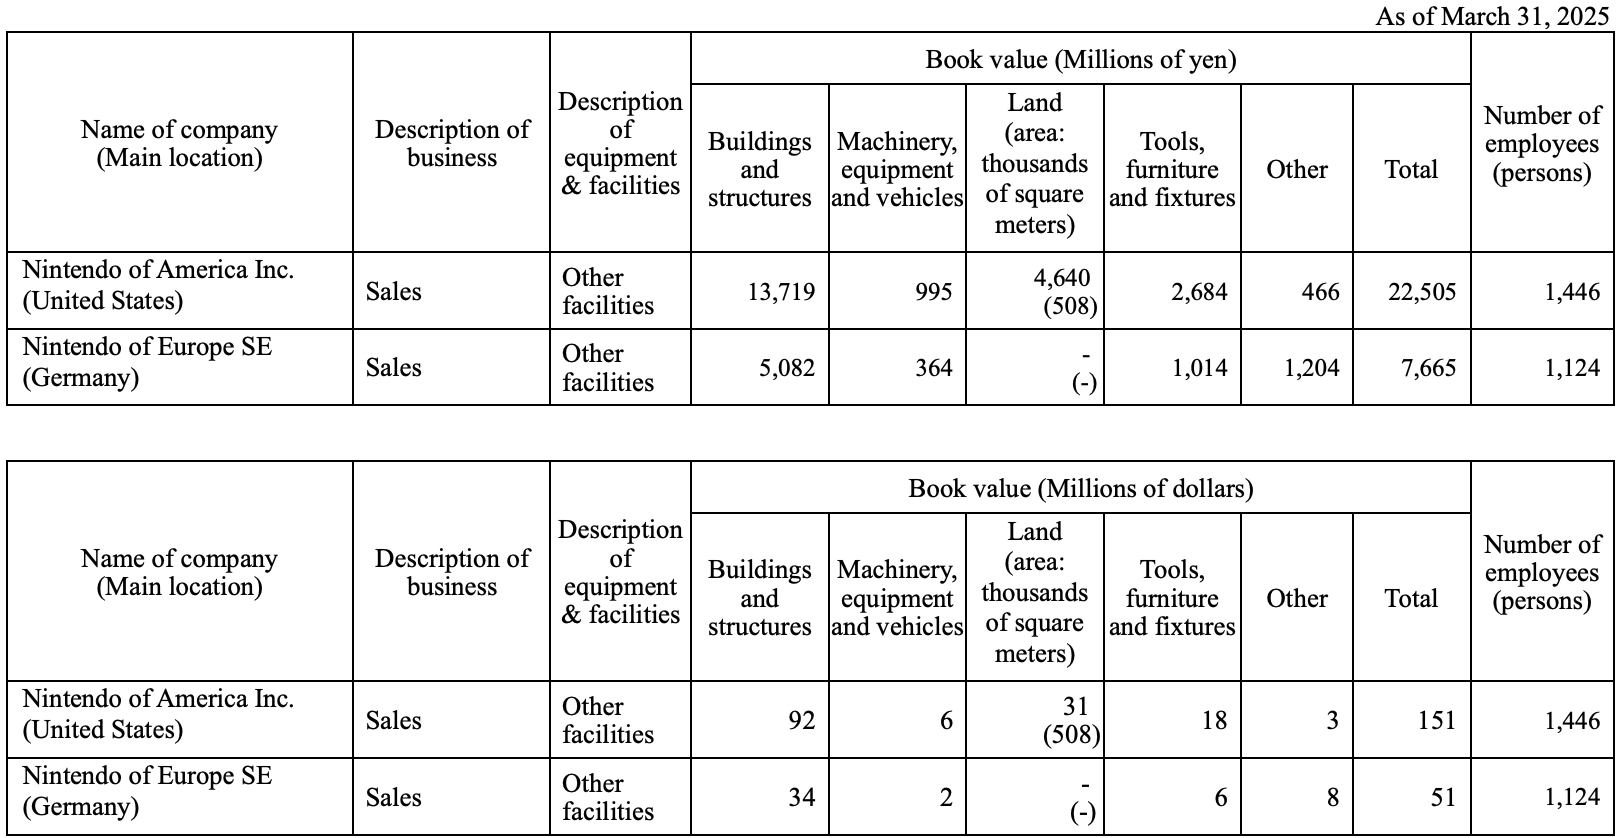
Overseas Subsidiaries Main Facilities (Raw Data Image)

Future Capital Investment Plan (Apr 2024 - Mar 2027)

Planned Investment Breakdown

This stacked bar chart breaks down the planned total investment of ¥158,000 million JPY over the next three fiscal years, with significant allocations to R&D and building renovations.

Future Capital Investment Plan

Future Capital Investment Plan (Raw Data Image)

  • Planned total investment: ¥158,000 million JPY (USD 1,060 million).
  • Major investments for R&D facilities (¥58,000 million JPY / USD 389 million), molds etc. production facilities (¥6,000 million JPY / USD 40 million), and renovation/update of other buildings (¥94,000 million JPY / USD 630 million).
  • All future funding planned to be covered by internal financing.

Company Profile

Share Status and Other Related Matters

Issued Shares Overview & Trend

  • Authorized shares: 4,000,000,000 common shares.
  • Issued shares as of March 31, 2025: 1,298,690,000 shares.
  • Stock listed on Tokyo Stock Exchange Prime Market, 100 shares per unit.

Issued Shares Total Trend (Click image to enlarge).

Issued Shares Total Trend

Issued Shares Total Trend (Raw Data)

Shareholder Composition & Major Holdings (As of Mar 31, 2025)

The pie chart shows the breakdown of shareholder categories, with foreign shareholders holding the largest proportion. The bar chart highlights the holdings of the top individual institutional shareholders.

  • Total shareholders: 117,423. Foreign shareholders hold the largest proportion at 51.02%.
  • The Master Trust Bank of Japan, Ltd. (Trust Account) is the largest shareholder (16.67%). Top 10 shareholders collectively hold 44.78%.
  • Company holds 134,441,800 treasury shares, which have no voting rights. Total voting units: 11,632,786.

Click images to enlarge for original report data.

Shareholder Composition

Shareholder Composition (Raw Data)

Major Shareholders

Major Shareholders (Raw Data)

Voting Rights Status

Voting Rights Status (Raw Data)

Treasury Stock Acquisition & Related Matters

  • Acquired 306 treasury shares for ¥2,702,366 JPY (USD 18,136) in FY2025.
  • Disposed 10,000 treasury shares for ¥20,158,400 JPY (USD 135,291) through a restricted stock compensation plan.
  • Held 134,441,816 treasury shares as of March 31, 2025.

Dividend Policy

Basic Policy & Calculation Method

  • Internal Financing: Prioritizes internal retained earnings for future growth (capital investments) and maintaining strong liquidity.
  • Profit Return: Dividends based on profit levels achieved each fiscal period.
  • Twice Annually: Basic policy is two dividends per year (interim and year-end).
  • Dividend Calculation: Higher of (Consolidated Operating Profit x 33% / shares outstanding) or 50% of consolidated profit. Interim dividend uses 33% of six-month consolidated operating profit.
  • Retained Earnings Use: R&D, capital investments, procurement, advertising, network infra, and timely treasury stock repurchases.

FY2025 Dividend Payments

  • Interim Dividend: ¥35 JPY (USD 0.23) per share, total ¥40,748 million JPY (USD 273 million) resolved Nov 5, 2024.
  • Year-end Dividend: ¥85 JPY (USD 0.57) per share, total ¥98,961 million JPY (USD 664 million) resolved June 27, 2025 (scheduled).

Corporate Governance

Governance Overview & Structure

  • Basic View: Maximize long-term corporate value considering all stakeholders.
  • Goal: Establish highly transparent and sound governance, enhance corporate ethics.
  • Reason for Adoption: "Company with an Audit and Supervisory Committee" to strengthen board oversight and separate management/supervision from business execution via Executive Officer System for agility.

Company Governance System (Click image to enlarge).

Company Governance System

Company Governance System (Raw Data)

Board Composition & Key Bodies

  • Board of Directors: 13 directors (5 Audit & Supervisory Committee members), 6 external directors. Meets monthly for management decisions and supervision.
  • Nomination Advisory Committee: Non-mandatory, advises on director nominations and compensation, meets at least 3 times annually.
  • Audit & Supervisory Committee: 1 full-time internal, 4 external directors. Meets monthly for auditing business execution and opinion exchange.
  • Executive Management Committee: Representative Directors & Corporate Directors acting as executive officers. Meets twice monthly to review board proposals and business execution policies.
  • Compliance Committee: Chaired by General Affairs Division Senior General Manager, promotes compliance.
  • Risk Management System: Departments manage risks, Internal Auditing Department oversees, Compliance Committee promotes, Information Security & Product Safety Committees ensure respective safety. Subsidiaries require prior company approval for important matters.

Board & Committee Meeting Attendance (FY2025)

  • Board of Directors meetings: 12 held. Nomination Advisory Committee meetings: 3 held.
  • All Representative Directors and Corporate Directors maintained 100% attendance. External directors Chris Meledandri and Miyoko Demay attended 10/12 times (83.3%).

Note on External Director Independence: Chris Meledandri will no longer be registered as an independent executive by Tokyo Stock Exchange, Inc. after his re-election on June 27, 2025. This is due to his representation of Illumination Entertainment, a co-producer of new Super Mario Bros. animated films, increasing the importance of his relationship with Nintendo, thus no longer meeting independence criteria, despite no direct financial or IP licensing transactions.

Audit Status

Audit & Supervisory Committee & Internal Audit

  • Audit & Supervisory Committee members attend board meetings, review documents, meet with President. Full-time members conduct on-site audits.
  • Committee collaborates with Internal Audit Department (which has 7 members, independent of business execution, reports to President and Committee).
  • Audit & Supervisory Committee held 13 meetings in FY2025, with 100% attendance from all members.

Accounting Audit

  • Auditor: PricewaterhouseCoopers Japan LLC (since 1962).
  • Auditors work closely with Audit & Supervisory Committee and Internal Audit, reporting plans and results.
  • Responsible CPAs in FY2025: Keiichiro Kagi, Takuya Urakami, Yusuke Nishimura.
  • Auditor Appointment Policy: Terminate if reasons under Companies Act apply; propose non-reappointment if duties not performed or replacement improves audit.
  • Reappointment Reason: PwC Japan LLC's audit methods and results deemed reasonable; expected to continue appropriate audit.

Independent Auditor's Audit Compensation (FY2025)

This chart shows the audit compensation for the independent auditor, PricewaterhouseCoopers Japan LLC, broken down by Nintendo Co., Ltd. and its consolidated subsidiaries.

Independent Auditor Compensation

Independent Auditor Compensation (Raw Data)

Compensation for Personnel within the Same Network (FY2025)

This chart details the audit and non-audit compensation paid to personnel within the same network as the independent auditor, primarily for services provided to consolidated subsidiaries.

Same Network Personnel Compensation

Same Network Personnel Compensation (Raw Data)

  • Non-audit services for both reporting company and consolidated subsidiaries included tax-related consulting services.

Executive Compensation

Executive Compensation Policy

  • Transparency: Determined by Board resolution after Nomination Advisory Committee review.
  • External Reference: Benchmarked against external research firm salary surveys.
  • Directors (excluding Audit & Supervisory Committee & External Directors): Fixed, short-term performance-based, and long-term stock-based compensation.
  • External Directors: Receive only fixed compensation (due to supervisory and advisory role, not business execution).
  • Performance-based Compensation: Uses consolidated operating profit as benchmark; additional compensation paid if average of recent 3 FYs' consolidated operating profit and current FY's profit exceed ¥400.0 billion JPY (USD 2,684 million).
  • Stock Compensation: Restricted stock, conditions lifted after director resigns.
  • Directors (Audit & Supervisory Committee Members): Only fixed compensation (independent, audit/supervisory role).

Report Company Executive Compensation (FY2025)

This chart breaks down the total compensation for various executive categories at Nintendo Co., Ltd., highlighting the primary components of their remuneration.

Company Executive Compensation JPY

Company Executive Compensation (JPY, Raw Data)

Company Executive Compensation USD

Company Executive Compensation (USD, Raw Data)

Key Executive Consolidated Compensation (FY2025)

This chart provides a direct comparison of the total compensation for the two highest-paid executives, Shuntaro Furukawa and Shigeru Miyamoto, illustrating the significant role of performance-based pay.

Key Executive Compensation JPY

Key Executive Compensation (JPY, Raw Data)

Shareholding Status

Investment Share Classification & Non-Pure Investment Shares

This chart illustrates the breakdown of Nintendo's non-pure investment shares by type, primarily held for strategic business alliances rather than direct financial returns.

  • Nintendo primarily holds investment shares not for pure investment but to maintain and develop business alliances and relationships that enhance corporate value long-term.
  • The Board of Directors annually verifies the purpose and rationality of holding individual investment shares and their appropriateness. Shares may be disposed if their purpose diminishes.
  • As of March 31, 2025: 17 non-listed stock issues (book value ¥7,406 million JPY / USD 49 million); 11 other stock issues (book value ¥128,002 million JPY / USD 859 million).

Specific Investment Shares List (As of Mar 31, 2025)

Click images to enlarge for original report data.

Specific Investment Shares JPY

Specific Investment Shares (JPY, Raw Data)

Specific Investment Shares USD

Specific Investment Shares (USD, Raw Data)

  • DeNA Co., Ltd.: Largest holding (¥52,934 million JPY / USD 355 million) for business cooperation on Nintendo Account system and smart device applications.
  • BANDAI NAMCO Holdings Inc.: Increased stake to maintain platform software development business relationship. Book value ¥57,731 million JPY (USD 387 million).
  • Holds shares in financial institutions (Kyoto Financial Group, Mitsubishi UFJ Financial Group, Resona Holdings) for risk management and strong financial basis.
  • Nissha Co., Ltd. shares were entirely sold in FY2025 (previously for business relationship with electronics component supplier).
  • Holdings in BANDAI NAMCO Holdings Inc., KONAMI GROUP CORPORATION, SQUARE ENIX HOLDINGS CO., LTD., and KOEI TECMO HOLDINGS CO., LTD. for platform software development relationships.
  • Quantitative effects are difficult to describe, but purpose and rationality are annually evaluated by the board. Many investee companies also hold Nintendo shares.